


Bitcoin Cash trading attracts traders who want a liquid, established altcoin with clear technical patterns. BCH splits its history into halving cycles, and each cycle shapes market sentiment. Traders also watch support zones, resistance lines, and breakout signals to time their entries and exits. This guide explains each tool in plain language. It also shows how to manage risk so one bad trade does not wipe out your account. For more market guides, visit Scope Bitcoin.
Bitcoin Cash Trading Basics Every Trader Should Know
Bitcoin Cash split from Bitcoin in 2017 and focused on larger blocks and low fees. BCH trades on most major exchanges, so traders find deep liquidity and tight spreads. The coin often follows Bitcoin’s direction, but it also moves on its own news and halving events. Beginners should learn the spot market first before they try leverage. Spot trading limits your loss to the amount you invest. Futures and margin trading can liquidate your position within minutes. Every trader should also pick a clear timeframe, because a day trade and a swing trade need different tools. Check live prices on CoinGecko before you place any order.
How BCH Halving Cycles Work
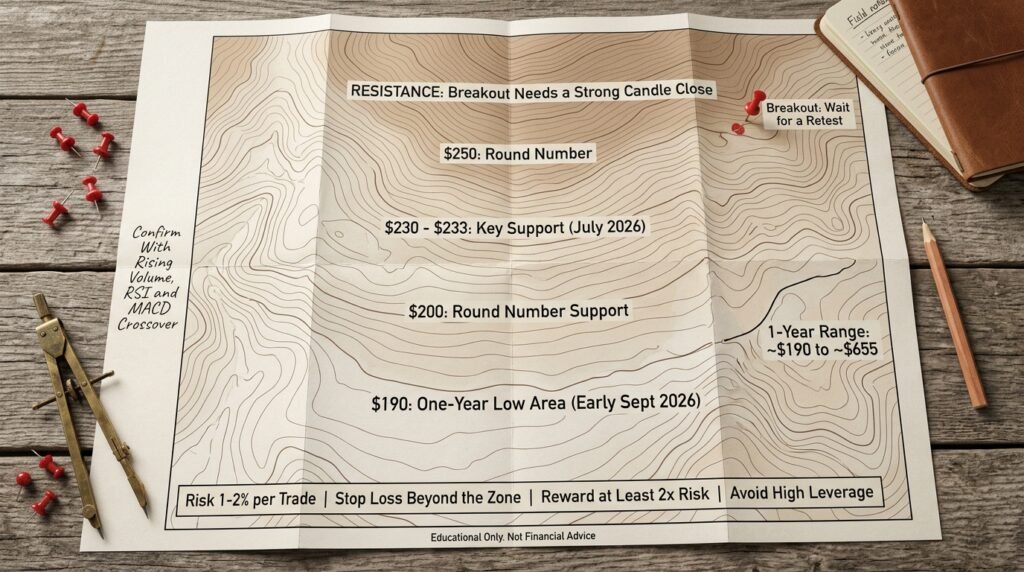
A halving cuts the block reward that miners receive, so fewer new coins enter the market. BCH halves its reward every 210,000 blocks, which takes roughly four years. The reward dropped from 12.5 to 6.25 BCH in 2020, and it fell again to 3.125 BCH in April 2024. Less new supply can support price when demand holds steady. However, the market often prices in the event weeks or months in advance. Miners also feel the squeeze, because their income drops overnight. Some miners shut down weaker machines, which can lower the network’s hash rate for a short time. Traders watch these shifts to gauge how the market reacts.
Past Halvings and Price Behavior
Past halvings gave traders mixed results, so no one should treat them as guaranteed profit signals. Price sometimes rallied before the event and then cooled after it. In other cases, the coin drifted sideways for weeks. These patterns depend heavily on the broader market, especially Bitcoin’s trend. A halving works best as a background factor, not as a trading signal on its own. Smart traders combine it with chart levels and volume. They also mark the next expected halving, which falls around 2028, and plan how they will manage positions as it approaches. This habit keeps them from chasing hype late.
How to Read Bitcoin Cash Trading Charts
Charts show price, volume, and time in one view, and they form the base of every technical decision. Candlestick charts display the open, high, low, and close for each period. A long green candle signals strong buying, while a long red candle signals heavy selling. Moving averages smooth out noise and reveal the trend direction. The 50-day and 200-day averages work well for swing traders. Traders also use the Relative Strength Index to spot overbought and oversold conditions. A free platform like TradingView offers all these tools. Start with a daily chart for the big picture, then zoom into shorter timeframes to refine entries.
Key BCH Support Levels to Watch
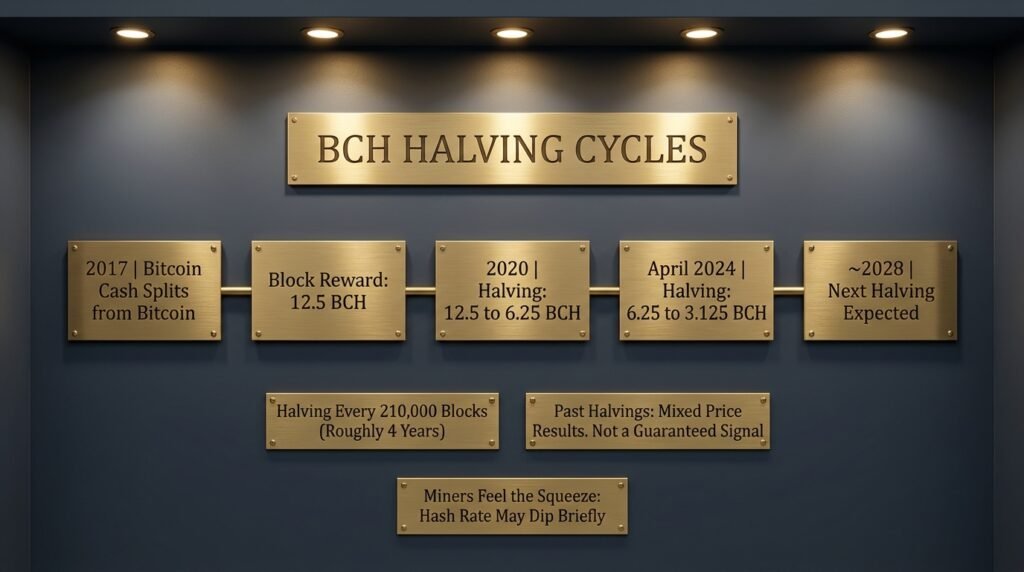
Support is a price zone where buyers have stepped in before and pushed the price back up. When BCH falls toward such a zone, many traders look for a bounce. Recent analysis highlighted the $230 to $233 region as a critical support zone in July 2026. Data from DappRadar showed that BCH traded between roughly $190 and $655 over the past year as of early September 2026. That wide range shows how large the swings can get. Remember that support levels change as price moves, so always verify them on a live chart. A level only matters until the market breaks it with strong volume. binancedappradar
How to Find Support Zones
Traders find support by looking left on the chart. They mark areas where the price bounced several times, because repeated reactions make a zone stronger. Round numbers like $200 or $250 often act as psychological support as well. Moving averages, especially the 200-day line, can also serve as dynamic support. Look for places where several signals overlap, because those zones carry more weight. Draw zones as bands, not exact lines, since price rarely turns at one precise number. After a break below support, that zone often flips into resistance. Update your levels weekly to keep your map fresh.
Breakout Signals for Bitcoin Cash Trading
A breakout happens when price pushes above resistance or below support and keeps going. Traders love breakouts because they can start strong trends. However, false breakouts trap many beginners. A real breakout usually shows a decisive candle close beyond the level, not just a quick spike. Traders often wait for a retest, where price returns to the broken level and holds it. That retest gives a safer entry with a tighter stop loss. Tight consolidation before the move also improves odds, because it shows the market is storing energy. Always place a stop loss just beyond the breakout zone to limit damage if the move fails.
Volume and Momentum Confirmation
Volume tells you whether real money backs a move. A breakout on rising volume carries more trust than one on thin volume. Traders compare current volume with the recent average to judge strength. Momentum indicators add another layer of proof. The RSI should climb without hitting extreme overbought levels too early, and the MACD should show a bullish crossover. If volume fades while price pushes higher, traders call that a warning sign. They then reduce position size or tighten stops. Combine two or three confirmations before you act, because one signal alone often misleads. Patience here saves money, and it keeps emotions out of your decisions.
Risk Management in Bitcoin Cash Trading
Risk management decides whether a trader survives long enough to profit. Most professionals risk only 1% to 2% of their account on each trade. They set a stop loss before they enter, and they never move it further away. Position sizing then follows from that stop distance. A trader should also seek a reward at least twice the size of the risk. Avoid high leverage, because small price swings can trigger liquidation. Keep a trading journal to record entries, exits, and reasons. Review it each month to find patterns in your mistakes. Never invest money you cannot afford to lose, and treat every plan as a hypothesis, not a promise.
Common Mistakes Traders Make
Many traders lose money because they chase pumps and buy after the move has already run. Others ignore stop losses and hope that a falling trade will recover. Overtrading also drains accounts through fees and emotional fatigue. Some traders rely on one indicator and ignore the bigger trend. Others trade every rumor on social media without verifying the source. Beginners often use too much leverage and then panic when price swings against them. A calm routine fixes most of these problems. Write down your plan, follow your rules, and review your results honestly. Learn more strategy basics in the guides at Scope Bitcoin.
FAQs About Bitcoin Cash Trading
When is the next Bitcoin Cash halving?
The next halving should arrive around 2028, since BCH halves every 210,000 blocks.
Does the BCH halving always push the price higher?
No. Past halvings produced mixed results, and the broader market often matters more.
What is the best timeframe for Bitcoin Cash trading?
Beginners usually start with daily charts for swing trades, then add shorter timeframes as they gain experience.
How do I spot a real breakout?
Look for a strong candle close beyond the level, rising volume, and a successful retest.
Is Bitcoin Cash trading risky?
Yes. Prices swing sharply, and leverage can amplify losses quickly.
Final Thoughts
Bitcoin Cash offers traders clear tools: halving cycles for context, support levels for entries, and breakout signals for momentum. No single tool guarantees profit, so combine them and confirm every setup. Strong risk management matters more than any indicator. Practice on small positions, keep a journal, and refine your plan over time. This article offers education, not financial advice. Explore more crypto guides at Scope Bitcoin.
