

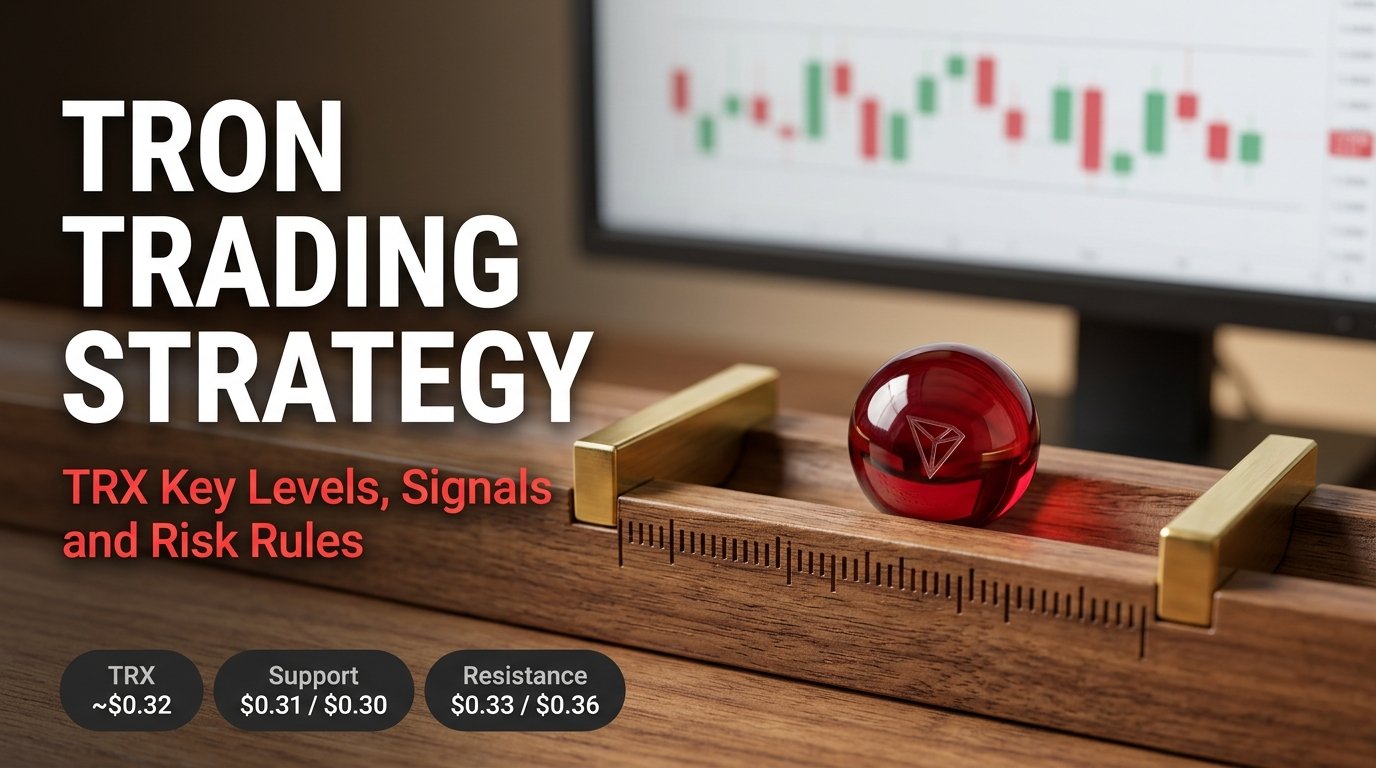
A solid TRON trading strategy starts with the price map, not with predictions. TRX trades in a tight range near $0.32, and traders watch both a nearby floor and a stack of overhead barriers. Momentum remains mixed, while fresh news adds pressure and support at the same time. This guide breaks down the key levels, the signals that matter, and the risk rules that protect your account. For more market coverage, visit Scope Bitcoin.
TRON Trading Strategy: Where TRX Trades Now
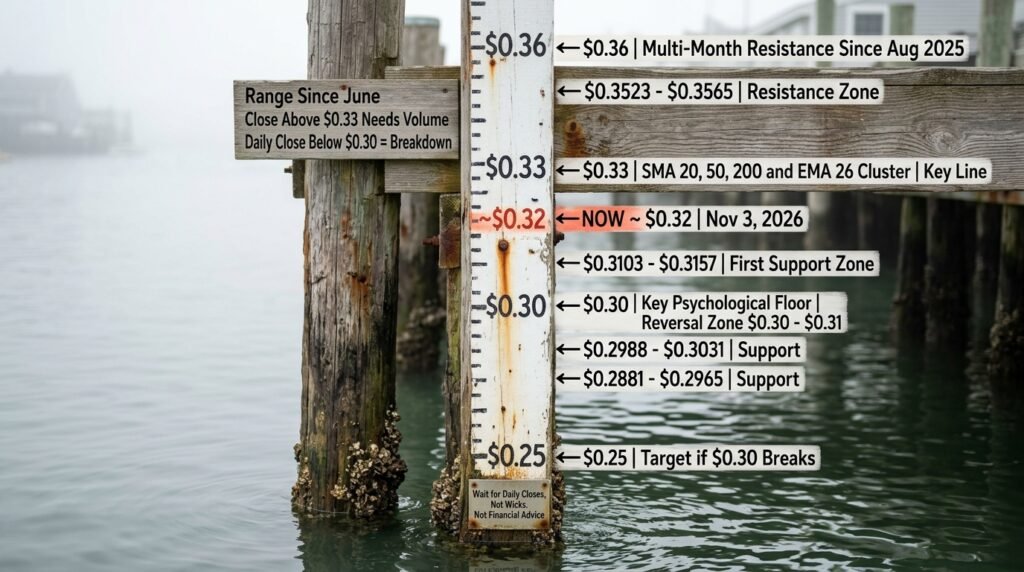
TRX sits in a narrow band after weeks of sideways action. Blockchain. News reported that TRX traded at $0.32 on Binance spot on November 3, 2026, after a 1.93% gain, but stayed below a cluster of moving averages near $0.33. A later note said spot stays flat and futures lean mildly long. That combination shows a market that lacks conviction. Neither bulls nor bears control the tape. Traders should therefore focus on the edges of the range and wait for a decisive break. Live quotes are available on TradingView. blockchainblockchain
TRON Trading Strategy: Key TRX Support Levels
Support marks the zone where buyers have defended price before. The nearest floor sits just below the current price. CoinCheckup lists the first support zone at $0.3103 to $0.3157, with deeper zones at $0.2988 to $0.3031 and $0.2881 to $0.2965. FxPro’s wave analysis also noted that TRX reversed up from the support zone between $0.3100 and $0.3000 on November 3. That zone forms the lower border of a sideways range that began in June. Traders treat $0.31 as the first line and $0.30 as the key psychological floor. coincheckuptradingview
What Happens if $0.30 Breaks
A clean break below $0.30 would change the structure. One analyst argued that losing $0.30 support could open the way toward $0.25. The same report warned that the rising wedge breakdown is not confirmed yet. Traders should therefore wait for a daily close below the level, not a quick wick. After a break, the old support often flips into resistance. Short sellers then look for a retest of $0.30 before they enter. Long buyers should step aside until price stabilizes. A confirmed breakdown also raises liquidation risk for leveraged longs. tronweekly
TRX Resistance Levels and Breakout Triggers
Resistance marks the area where sellers have capped price. The first obstacle sits near $0.33, where several averages meet. Above that, CoinCheckup marks a resistance zone from $0.3523 to $0.3565. The bigger barrier lies higher. FxPro described a strong multi-month resistance at $0.3600 that has rejected price since August 2025. A breakout needs a daily close above $0.33, rising volume, and ideally a retest. Without volume, a pop above resistance often fails. Traders should scale into positions as each level breaks, instead of buying the whole move at once. coincheckuptradingview
How Moving Averages Shape the TRON Trading Strategy
Moving averages act as dynamic support and resistance. Blockchain. News showed that the SMA 20, SMA 50, SMA 200, and EMA 26 all read about $0.33, the same level the data marks as strong resistance. That clustering makes $0.33 the most important line on the chart. A close above the cluster would signal a short-term shift toward buyers. Failure to break it keeps the sideways structure alive. Traders also watch the shorter 7-day average, which currently tracks price closely. The 7-day line works well for quick momentum checks, while the 200-day line frames the bigger trend. blockchain
Momentum Signals: RSI, Taker Flow, and Open Interest
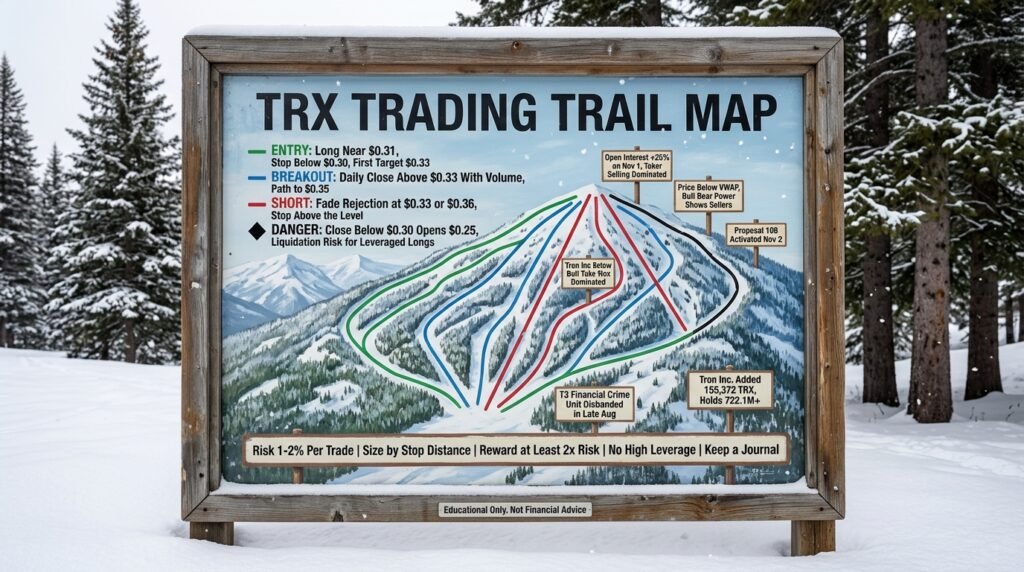
Momentum tools show whether buyers or sellers drive the move. CoinCheckup noted that price trades below the volume-weighted average, which suggests the move is losing volume-backed support. Its Bull Bear Power reading also showed sellers in control. Taker data adds more detail. Blockchain. News reported earlier that futures open interest surged 25% on November 1, while taker selling dominated. Rising open interest with falling price often signals fresh shorts or trapped longs. Traders should combine RSI, volume, and open interest before they trust any move. One indicator alone often misleads. coincheckupblockchain
News Factors That Move TRX
News flow adds pressure on top of the chart. CoinMarketCap’s analysis highlighted two issues. First, the T3 Financial Crime Unit, a partnership between Tron, Tether, and TRM Labs, was disbanded in late August. Second, Elliptic’s analysis showed that a significant portion of the stolen $6.3 billion from the recent Binance hack passed through the Tron network. Both stories hurt sentiment. On the positive side, governance Proposal 108 activated on November 2 and optimizes smart contract storage. Traders should watch headlines closely, because negative news can break support quickly. Latest TRON (TRX) Price Analysis +2
Tron Inc. Treasury Buying
Corporate buying gives TRX a quiet source of demand. Coin-Turk reported that Tron Inc. added 155,372 TRX to its treasury and now holds more than 722.1 million tokens. Treasury purchases do not move price on their own, but they show long-term conviction from a large holder. They also reduce the supply on exchanges. Still, traders should not treat Treasury news as a trading signal. The same report warned that analysts watch $0.30 support closely after signs of weakening momentum. Chart levels still decide short-term direction. Fundamentals matter over longer timeframes. coin-turk
Building a TRON Trading Strategy With Entries and Stops
A practical plan uses the range edges. Traders can look for long entries near $0.31 with a stop just below $0.30, targeting $0.33 first. A stronger signal comes after a daily close above $0.33, which opens the path toward $0.35. Short sellers can fade rejection at $0.33 or $0.36, with stops above the level they trade. Always define the stop before you enter. Aim for a reward at least twice the risk. Skip the trade if the setup fails to meet that ratio. Patience matters more than activity in a tight range.
Risk Management for TRX Traders
Risk control keeps you in the game. Risk only 1% to 2% of your account on each trade, and size the position from your stop distance. Avoid high leverage, because a range-bound market can still produce sharp wicks. Reduce size before major news, such as regulatory updates or network proposals. Track your trades in a journal and review them every week. Never add to a losing position without a clear plan. Use CoinMarketCap’s TRX analysis to follow daily context. Read more trading guides at Scope Bitcoin.
FAQs About TRON Trading Strategy
What are the key TRX support levels?
Traders watch $0.31, $0.30, and $0.25 as the main downside zones.
What is the main TRX resistance level?
The $0.33 moving average cluster comes first, followed by $0.35 to $0.36.
Is TRX bullish or bearish right now?
The market looks neutral, with price trapped between $0.31 support and $0.33 resistance.
What news affects TRX price?
Network upgrades, treasury buying, and security headlines around laundering on Tron all influence sentiment.
How much should I risk per TRX trade?
Most traders risk only 1% to 2% of their account on a single trade.
Final Thoughts
TRX trades in a tight range with clear levels on both sides. Support near $0.31 and $0.30 guards the downside, while the $0.33 cluster and $0.36 barrier cap the upside. Momentum stays mixed, and news adds extra risk. A disciplined TRON trading strategy waits for confirmation, uses stops, and protects capital first. This article offers education, not financial advice. For more crypto insights, visit Scope Bitcoin.
