


Hyperliquid trading analysis starts with three numbers: open interest, volume, and price. HYPE climbed near its record high in late September, then slid sharply through October. Derivatives traders now watch every shift in positioning for clues about the next move. This article breaks down the latest data, the key support and resistance zones, and the risks that matter most. Use it as a research guide, not as a trade signal. For more crypto coverage, visit Scope Bitcoin.
Hyperliquid Trading Analysis: Where HYPE Trades Now
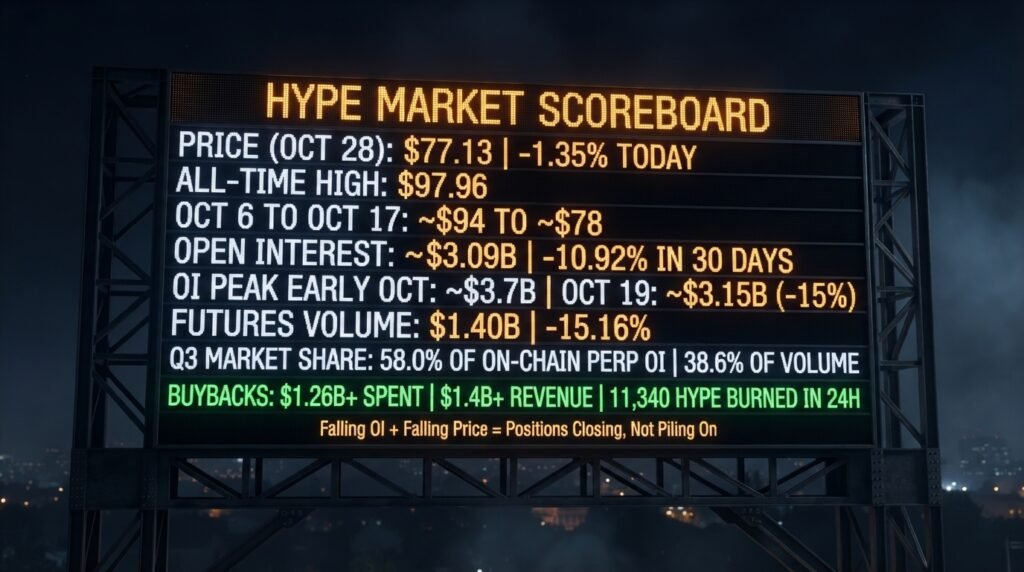
HYPE trades in the high $70s as of late October. Market trackers show a price of $77.13 on October 28, 2026, after a 1.35% daily drop. That level sits well below the all-time high, which CoinStats lists at $97.96. The token also slipped from its early October strength. CoinGecko noted that price fell from about $94 on October 6 to near $78 by October 17. This drop shows how quickly sentiment can flip in a leveraged market. Track live quotes on CoinGecko before you form any view. 58 percent Q3 open interest: What it means for the Hyperliquid price +2
What Open Interest Tells Traders About HYPE
Open interest measures the total value of derivatives positions that traders still hold open. Rising open interest with rising price usually signals fresh money entering the trend. Falling open interest during a price drop suggests traders are closing positions rather than adding to them. HYPE sits in that second group right now. Data from CoinStats showed open interest near $3.09 billion, a 10.92% decline over 30 days. A falling number reduces the risk of forced liquidations, but it also shows weaker conviction. Traders should compare open interest on one tracker only, because different sites count different venues and report different totals. cryptonews
Why Open Interest Fell From the October Peak
Open interest peaked in early October and then cooled. Coinglass data showed that open interest sat near $3.15 billion on October 19, about 15% below the early October peak of roughly $3.7 billion. The same report noted that price fell harder than open interest. That pattern often means traders held many positions through the drop instead of closing them. It can also mean that new shorts entered the market while longs stayed trapped. Both cases raise the odds of sharp moves. Liquidation cascades can then push price past obvious levels in either direction. coingabbar
Hyperliquid Trading Analysis of Volume and Market Share
Volume shows how actively traders use the platform, and it confirms or weakens every price move. Crypto.news reported that futures volume fell 15.16% to $1.40 billion while open interest slipped 0.52% to $3.07 billion in one October 25 snapshot. Lower volume during a drop often signals fading selling pressure, though it does not guarantee a bottom. Hyperliquid still leads its category by a wide margin. Alea Research reported that the platform held 58.0% of on-chain perpetual open interest and 38.6% of volume in the third quarter. That dominance gives HYPE a strong fundamental base. cryptoad-hoc-news
How the Buyback Model Supports HYPE Demand
Hyperliquid sends most of its trading revenue into an assistance fund that buys HYPE on the open market. This steady buying creates a floor of demand during weak markets. A Castle Labs report found that the protocol earned more than $1.4 billion in cumulative revenue and spent over $1.26 billion on HYPE buybacks. Daily activity continues as well, since TokenPost reported that the protocol repurchased and burned 11,340 HYPE in a single 24-hour window in late October. Buybacks cannot stop every decline, but they absorb supply. They also tie token demand to real platform usage. Read our full Hyperliquid explainer for the mechanics. hokanewsad-hoc-news
Hyperliquid Trading Analysis: Key Support Zones
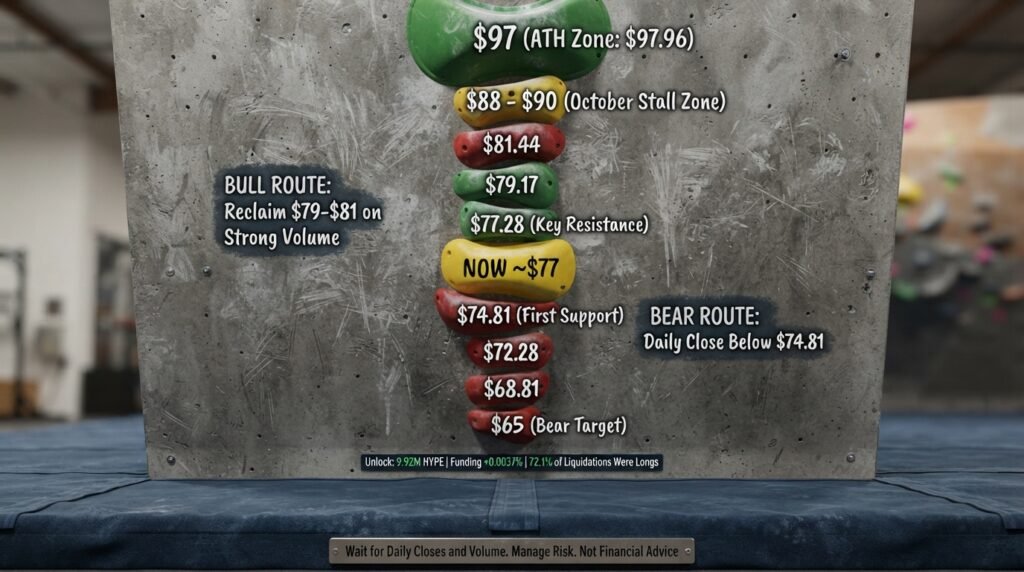
Support marks the area where buyers have stepped in before. Analysts currently watch the mid-$70s closely. Cryptonews.net listed immediate support at $74.81, with bearish targets at $72.28 and $68.81. Crypto.news also highlighted the $75 level and a possible slide toward $65 if that floor fails. The $77 area acted as a pivot in recent sessions, so a clean daily close below it would weaken the structure. Draw support as a band, not a single line, because price rarely turns at an exact number. Wait for a close below the band before you assume a breakdown. cryptonewscrypto
Key HYPE Resistance Zones and Breakout Triggers
Resistance marks the area where sellers have capped price before. The nearby barrier sits around $77 to $79. Cryptonews.net placed key resistance at $77.28, with bullish targets at $79.17 and $81.44. Crypto.news framed the broader battle between a drop toward $65 and a recovery above $80. A true breakout needs a strong daily close above resistance, rising volume, and ideally a successful retest. Traders also watch the $88 to $90 zone, where price stalled earlier in October. A move through $97 would put the all-time high back in play. Without volume, any pop above resistance deserves suspicion. cryptonewscrypto
Token Unlocks and Supply Pressure
Scheduled unlocks add supply to the market and can pressure price. Cryptonews.net flagged a scheduled unlock of 9.92 million HYPE. Recipients may sell part of that supply, although many hold long term. Traders therefore track unlock dates on their calendars and reduce leverage before them. Strong buyback demand can offset some of the new supply. Still, the net effect depends on market mood at the time. When sentiment looks weak, unlocks often hit harder. When sentiment looks strong, the market absorbs them with little reaction. cryptonews
Hyperliquid Trading Analysis of Funding and Liquidations
Funding rates show which side pays the other in perpetual markets. A positive rate means longs pay shorts, which signals bullish crowding. The same report listed a funding rate of +0.0037% and long liquidations at 72.1%. That mix tells a clear story. Longs took most of the pain during the October slide, and the market flushed many leveraged buyers. A flush can clear the path for a bounce, because fewer weak hands remain. However, traders should not assume a reversal until price reclaims key levels. Use Coinglass to monitor funding and liquidation data in real time. cryptonews
Bull and Bear Scenarios for HYPE
The bull case needs price to reclaim $79 to $81 on strong volume. That move would turn nearby resistance into support and open a path toward the high $80s. Falling open interest could also fuel a squeeze if shorts crowd in and price turns higher. The bear case starts with a daily close below $74.81. That break could pull price toward $72 and then the high $60s. Slowing volume and weak buyback pace would strengthen this scenario. Neither path carries certainty. Traders should prepare for both and size positions so that either outcome stays manageable.
Risk Management for HYPE Traders
Strong analysis means little without strict risk control. Risk only a small fraction of your account on each trade, and set a stop loss before you enter. Avoid high leverage on HYPE, because one fast candle can trigger liquidation. Reduce size before major events such as token unlocks and macro announcements. Keep a journal of every entry, exit, and reason so you can spot recurring mistakes. Never trade money you cannot afford to lose. Always read the official Hyperliquid documentation to understand fees, margin rules, and liquidation mechanics before you open any position.
FAQs About Hyperliquid Trading Analysis
What is the current HYPE price?
HYPE trades near $77 as of October 28, 2026, but the price changes every minute.
What are the key HYPE support levels?
Analysts watch $74.81, $72, and the high $60s as the main downside zones.
Why does open interest matter for HYPE?
Open interest shows how much leveraged money sits in the market, and it helps traders judge trend strength.
How do buybacks affect HYPE?
The protocol uses most trading revenue to buy HYPE, which creates steady demand.
Is HYPE a safe trade?
No. Leverage, unlocks, and volatility create serious risk, so size positions carefully.
Final Thoughts
Hyperliquid trading analysis shows a market in transition. Open interest has cooled, volume has softened, and price sits near critical support in the mid-$70s. Strong fundamentals, including market share and steady buybacks, give HYPE a solid base. However, token unlocks and leveraged positioning keep risk high. Watch the key zones, confirm every move with volume, and manage risk first. This article offers education, not financial advice. Explore more crypto insights at Scope Bitcoin.
