


This BNB trading analysis shows where the market stands today and what traders should watch next. BNB trades near $735 after a choppy October, and it still sits far below its 2025 peak. We study key support and resistance, examine recent volume, and map three short-term scenarios. Read on to build a clear and practical trading plan. For more market coverage, visit ScopeBitcoin.
BNB Trading Analysis: Where the Market Stands Today
BNB changes hands near $735 as October 2026 draws to a close. Price opened the month around $768 and has slipped since then. On October 5, BNB touched an intraday high near $809. Then sellers took control on October 8. That day, Investing.com data shows BNB fell almost 5% and printed a low near $718.
Since that drop, buyers have defended the $710 to $725 area several times. Meanwhile, the coin trades roughly 46% below its record high of $1,369.99 from October 2025. This gap shows how far the broader market has cooled since last autumn. However, BNB has held up better than many large altcoins during the slowdown. Therefore, traders now watch whether the coin can rebuild momentum above the $750 zone.
Key BNB Support and Resistance Levels
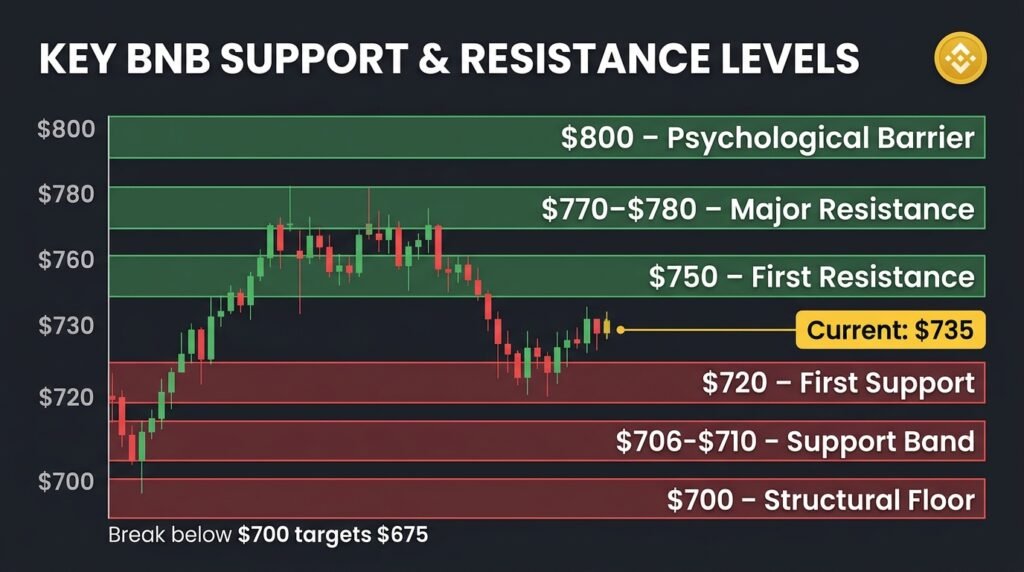
Key levels give traders a map of where buyers and sellers act. BNB currently trades inside a range between roughly $700 and $770. Analysts mark $700 as the main structural floor for October. They also watch $770 as the ceiling of the monthly channel. The 50-day exponential moving average sat near $734 in mid-October, right inside this range.
Price crosses that average often, so it works as a pivot line. Therefore, traders treat the zone between $720 and $750 as a decision area. A clean break outside the range usually starts the next trend. Also, round numbers like $700 and $800 attract heavy order flow. The next two sections break these levels down one by one.
Key Support Levels for BNB
The first support sits near $720, where buyers stepped in during mid-October. On October 15, price dipped to about $710 before it recovered. That wick shows that dip buyers defend the $710 area. The October 18 low at $706 reinforces the same zone. Together, these lows form a support band from $706 to $725.
The $700 level acts as the major structural floor beneath that band. A daily close below $700 would break the October range. In that case, the next area to watch sits near $675, which marked a recent monthly low. Traders often wait for a daily close, not a quick wick, before they act. This patience reduces false signals around these levels.
Key Resistance Levels for BNB
The first resistance appears near $750, close to recent daily highs. BNB reached $751.80 on October 21, but it reversed lower the next day. The $770 to $780 zone presents the next hurdle. Price lost that area on October 8, and sellers still defend it. Above it, $800 stands as a psychological barrier.
BNB touched $809 on October 5, yet it could not hold the move. Therefore, buyers need strong volume to clear $800 for good. Each resistance zone also offers a spot where traders take profit. Moreover, failed breakouts there often trigger quick pullbacks. For another example of support and breakout analysis, read our Bitcoin Cash (BCH) trading guide.
Volume Trends Behind BNB’s Price Action
Volume shows how much conviction stands behind each price move. Rising volume during a move confirms that traders believe it. Falling volume during a move warns that the trend may fade. BNB’s October data gives a clear example of both patterns. Daily volume ran from about 5 million to nearly 19 million BNB.
The biggest spike came on October 8, the day BNB fell almost 5%. Heavy selling on that day confirmed real distribution, not random noise. Since then, volume has stayed lower on most days. However, October 22 and 23 brought volumes above 13 million. That rise suggests traders are positioning for a bigger move.
What Recent Volume Tells Traders
On October 17 and 18, volume stayed near 6 to 7 million while price drifted to $718. Price then rose from October 19 to 21 on higher volume. CoinLore’s historical data confirms the same mid-October bounce. That pattern shows healthy accumulation rather than a thin rebound. However, the October 22 reversal came with 14 million units.
Heavy volume on a down day signals that sellers still defend $750. Then October 23 brought a rebound on similar volume. This tug of war shows a market without a clear winner. Also, the coin’s market cap near $96 billion keeps liquidity deep. Still, sudden spikes can widen spreads, so traders should size positions carefully.
How to Read Volume at Key Levels
Check volume every time price touches a support or resistance zone. The average daily volume in October ran near 10.5 million. A breakout above $750 on volume well above that average carries more weight. A breakout on weak volume often fails within a day or two. Likewise, a drop below $700 on heavy volume confirms real selling.
A drop on thin volume often reverses quickly. Compare each day’s volume with the 10-day average. Also, watch for volume spikes that end in long candle wicks. Those wicks show that one side absorbed the other side’s orders. Combine volume with price structure, not with a single indicator, to filter out weak signals.
Short-Term BNB Scenarios: Bullish, Bearish, and Sideways
No one can predict the market, but scenarios help traders prepare. Each scenario below ties directly to the levels and volume cues above. Traders should treat these as possibilities, not promises. The current range gives three realistic paths over the next few days. Price can break upward through $750 and $770.
Price can also break downward through $720 and $700. Alternatively, it can keep chopping inside a tight band. Sideways action has dominated much of October so far. However, tight ranges often end with a sharp move. Therefore, the next three sections outline what each path looks like.
Bullish Scenario: A Breakout Above $750
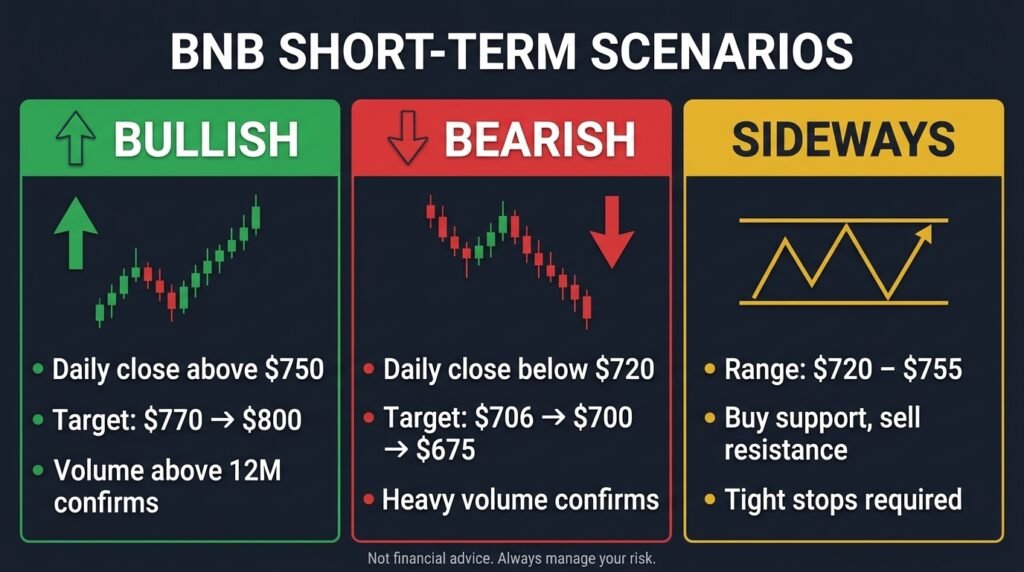
The bullish case starts with a daily close above $750. Buyers then target the $770 resistance, about 5% above the current price. Rising volume above 12 million would confirm that move. A strong close above $780 opens the path toward $800. At $800, BNB meets a psychological barrier near the September high around $807.
A bullish breakout would also reclaim the 50-day average as support. Traders could then trail stops under each higher low. In addition, a stronger broader crypto market often lifts BNB alongside Bitcoin. Our Ethereum future scope analysis shows how large altcoins can move together. Even in this case, traders should expect pullbacks along the way.
Bearish Scenario: A Breakdown Below $720
The bearish case begins when BNB loses $720 on a daily close. Sellers then aim for the $706 to $710 lows from mid-October. A heavy-volume break below those lows would target $700. If $700 fails, the structural floor of October disappears. Price could then slide toward $675, a recent monthly low.
Failed attempts to clear $750 would add to the bearish pressure. Weak bounces on low volume would confirm that sellers hold control. In that case, traders may reduce long exposure or wait on the sidelines. Short sellers often place stops just above $750. Therefore, a squeeze can interrupt even a bearish move.
Sideways Scenario: Range Trading Between $720 and $755
The sideways case keeps BNB between $720 and $755. This path matches most daily closes since October 9. Volume usually fades during such phases. Range traders buy near support and sell near resistance. They keep stops tight because a breakout can arrive suddenly.
Patient traders instead wait for the range to resolve. Both approaches require discipline and clear exit rules. A sideways market also lets indicators like RSI reset. After that reset, the next trend often starts with fresh energy. Meanwhile, you can follow more market updates in our altcoin news section.
Risk Management Tips for BNB Traders
Strong analysis fails without strong risk control. First, decide how much you can lose before you enter a trade. Many traders risk only 1% to 2% of their capital per trade. Next, place a stop-loss at a level that invalidates your idea. For example, a long near $725 might use a stop below $700.
Also, avoid adding to losing positions. Keep position sizes smaller when volatility rises. BNB moved nearly 5% in a single day on October 8. Remember that crypto trades around the clock, so fast moves happen at any hour. Finally, confirm live prices on Binance before you place any order.
FAQs About BNB Trading Analysis
What are the key support levels for BNB right now?
BNB finds first support near $720. A band from $706 to $710 sits below it. The $700 level acts as the main structural floor for October.
What is the main resistance for BNB?
Traders watch $750 first, then the $770 to $780 zone. The $800 level stands as the larger psychological barrier.
Why does volume matter in BNB trading?
Volume shows conviction behind a move. A breakout on strong volume holds more often than one on thin volume.
Can anyone predict BNB’s next move with certainty?
No. Scenarios guide your planning, but markets can surprise everyone. Use stop-losses and size your positions carefully.
Final Thoughts
This BNB trading analysis shows a coin that trades inside a clear range. Support sits near $720 and $700, while resistance waits near $750, $770, and $800. Volume will decide which side wins, so watch it at every key level. Plan for all three scenarios, and keep your risk small. Markets change fast, so update your levels often. This article offers general information only and does not give financial advice. Always research the market yourself before you trade. Read our disclaimer for details.
