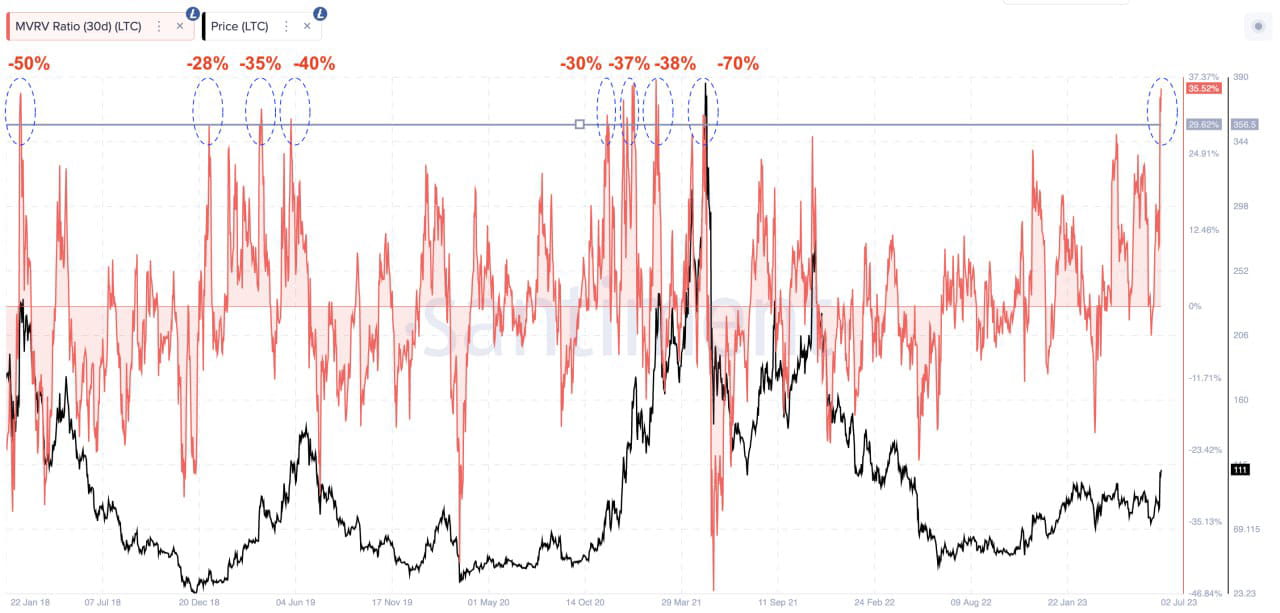
How to Use MVRV Z-Score to Determine If a Cryptocurrency Is Potentially Under or Overvalued
How to Use MVRV Z-Score: Cryptocurrency valuation can be a tricky landscape to navigate, with high volatility and unpredictable market movements. However, certain metrics, like the MVRV Z-Score, provide valuable insights into whether a cryptocurrency is potentially under or overvalued. In this article, we’ll break down what the MVRV Z-Score is, Crypto Trader Earned Over $500,000 how it works, and how you can use it to make informed decisions in your crypto investments.
What Is the MVRV Z-Score?
The MVRV Z-Score is a metric used to assess the relative value of a cryptocurrency by comparing its Market Value (MV) to its Realized Value (RV). It combines these values into a standardized score that indicates market extremes, such as overvaluation or undervaluation.
- Market Value (MV): The current market capitalization, calculated as the current price multiplied by the circulating supply.
- Realized Value (RV): A measure of the “real value” of a cryptocurrency based on the price at which each unit was last moved on the blockchain.
- Z-Score: A statistical measure that indicates how far a data point is from the mean, expressed in standard deviations.
The formula for the MVRV Z-Score is:
MVRV Z-Score=Market Value−Realized ValueStandard Deviation of Market Value\text{MVRV Z-Score} = \frac{\text{Market Value} – \text{Realized Value}}{\text{Standard Deviation of Market Value}}MVRV Z-Score=Standard Deviation of Market ValueMarket Value−Realized Value
How to Interpret the MVRV Z-Score
 The MVRV Z-Score helps identify whether a cryptocurrency is in the following states:
- Overvalued: When the MVRV Z-Score is significantly high (typically above 7 or 8), it indicates the cryptocurrency may be overvalued. This is often a signal for potential price corrections.
- Undervalued: When the MVRV Z-Score is significantly low (typically below -1 or -2), it suggests the cryptocurrency may be undervalued. This can indicate a buying opportunity.
- Neutral Zone: When the MVRV Z-Score is around 0, it signifies the cryptocurrency is fairly valued based on historical data.
How to Use the MVRV Z-Score in Crypto Investing
1. Identifying Market Cycles
The MVRV Z-Score is a powerful tool for identifying market tops and bottoms:
- Market Tops: A very high Z-Score often coincides with a bubble or euphoria phase, signaling that the asset may be due for a correction.
- Market Bottoms: A very low Z-Score often correlates with capitulation or oversold conditions, signaling potential recovery.
Limitations of the MVRV Z-Score
While the MVRV Z-Score is a useful tool, it’s not without limitations:
- Not a Standalone Metric: The Z-Score should be used alongside other indicators, such as on-chain metrics, technical analysis, and market sentiment, for a holistic view.
- Historical Basis: The Z-Score is based on historical data and may not always account for rapid shifts in market conditions or macroeconomic factors.
- Not Universal: This metric works best for cryptocurrencies with substantial historical and on-chain data, such as Bitcoin or Ethereum.
Practical Steps to Use MVRV Z-Score
- Find Reliable Data: Use trusted analytics platforms like Glassnode, Santiment, or CryptoQuant to access MVRV Z-Score charts.
- Analyze the Trend: Look for patterns in the Z-Score to identify overvalued or undervalued states.
- Combine With Other Metrics: Use the Z-Score alongside metrics like Relative Strength Index (RSI) or Moving Averages for a comprehensive analysis.
- Make Strategic Decisions: Use the insights to time your investments, balancing risk and reward.
Case Study: Bitcoin and MVRV Z-Score
Historically, Bitcoin’s MVRV Z-Score has accurately highlighted market extremes:
- 2017 Bull Run: The Z-Score exceeded 8, signaling a peak. Shortly after, Bitcoin’s price corrected sharply.
- 2020 Crash: The Z-Score fell below -1 during the market crash, indicating undervaluation. Bitcoin subsequently rallied to new all-time highs.
Conclusion
The MVRV Z-Score is a valuable tool for cryptocurrency investors looking to determine if an asset is under or overvalued. By understanding and interpreting this metric, you can make better-informed decisions and potentially optimize your returns. However, always combine the MVRV Z-Score with other analysis methods and maintain a diversified portfolio to manage risks effectively.
[sp_easyaccordion id=”5027″]


