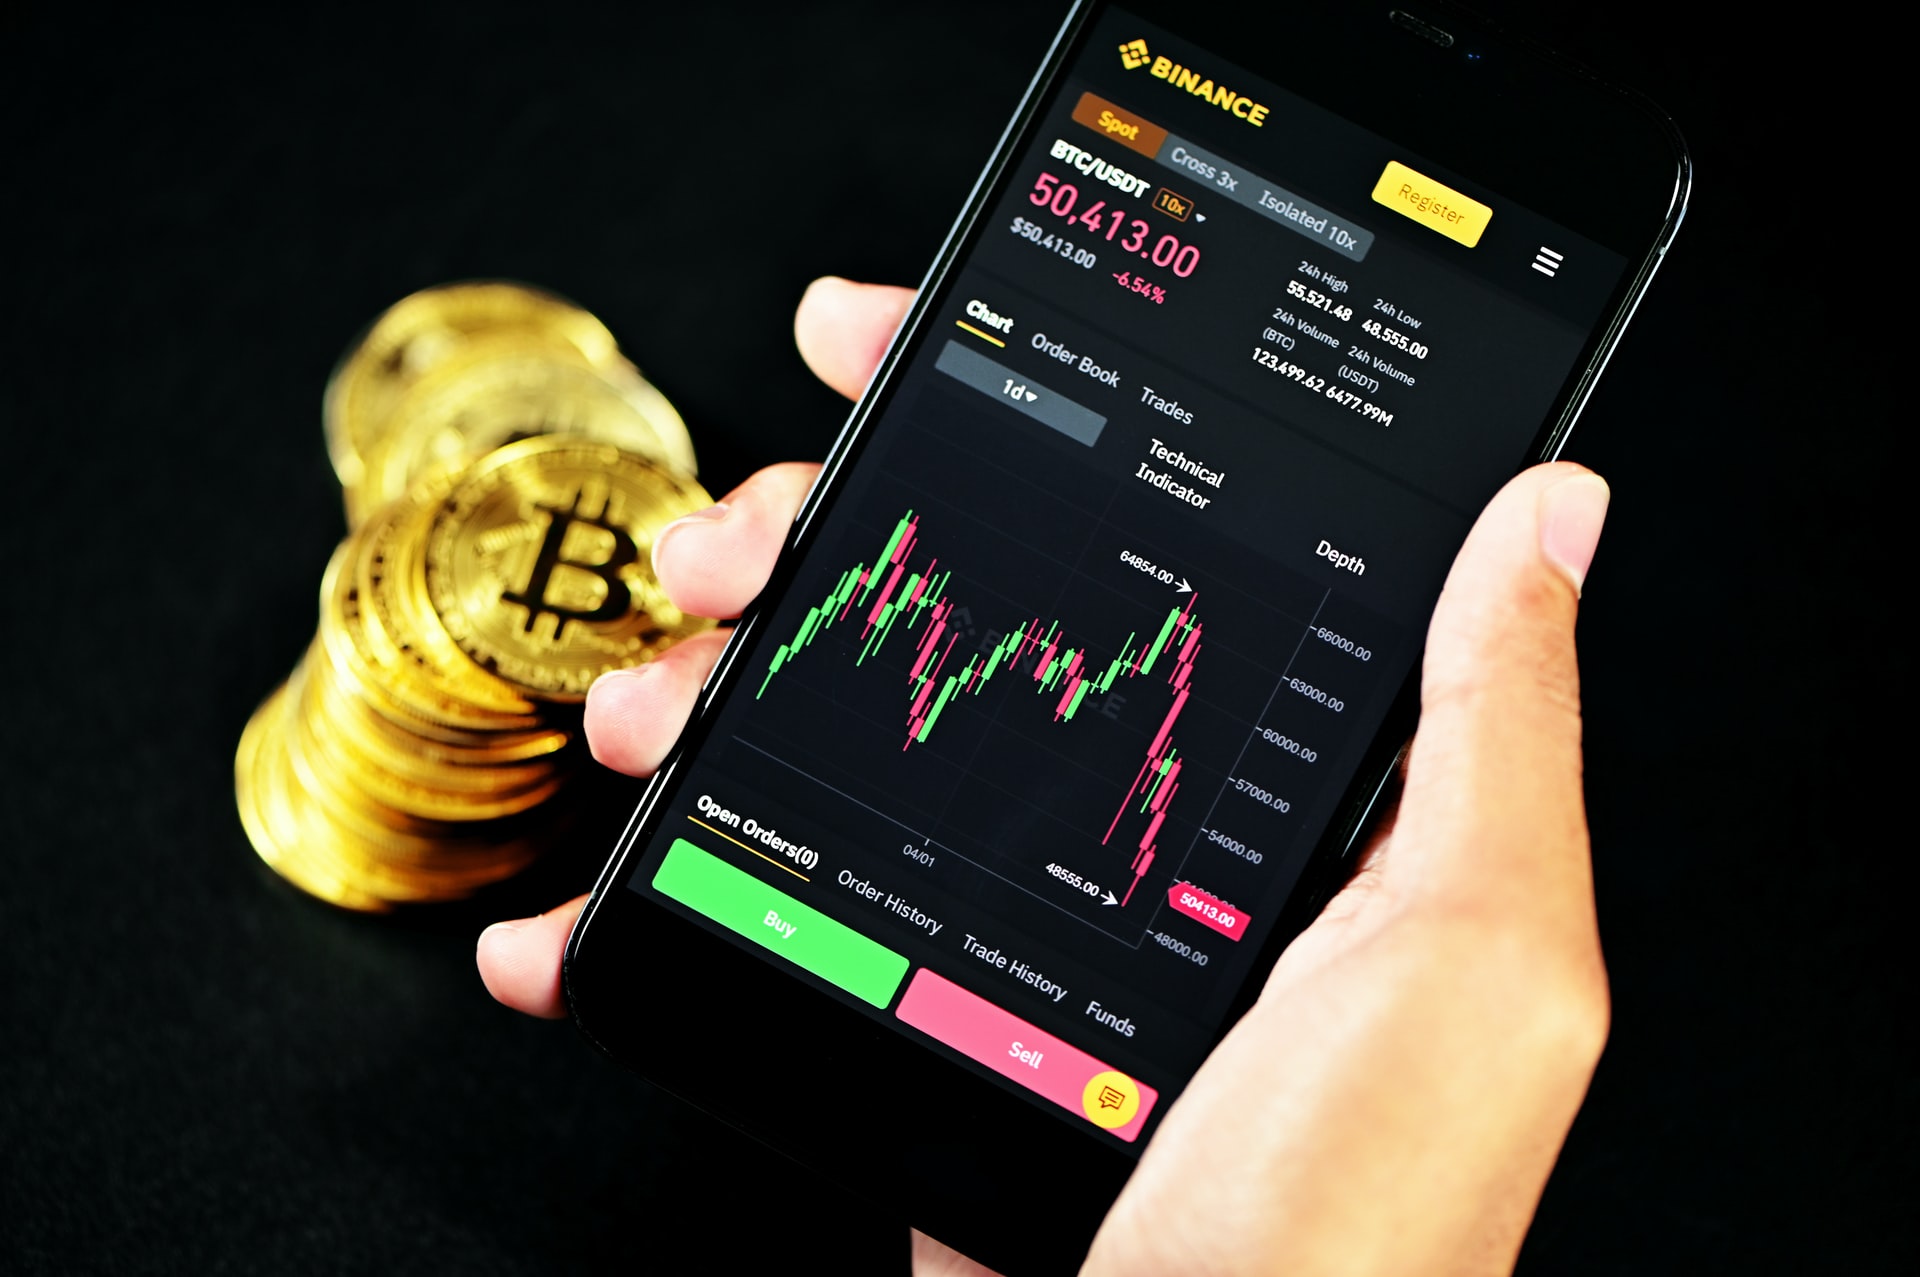
Bitcoin TradingView Pro Charts Alerts & Pine Script
If you’re serious about trading Bitcoin, you’ve probably heard people rave about Bitcoin TradingView as their go-to charting and analysis hub. TradingView brings together professional-grade charts, deep technical indicators, real-time alerts, strategy backtesting, and a social stream of community ideas—all accessible in your browser. For Bitcoin traders, that combination is powerful. You can track BTCUSD or BTCUSDT, test rules with Pine Script, set 24/7 server-side alerts, and even connect compatible brokers for execution, all within one streamlined workspace. Taken together, these features help you move from guesswork to a structured, repeatable process for analysing market structure, timing entries, and managing risk.
In this guide, you’ll get a practical walkthrough of how to use Bitcoin TradingView day to day. We’ll explore the charting toolkit, discuss indicator workflows such as RSI, MACD, and moving averages, explain how to build and backtest strategies with Pine Script, and show you how to configure alerts that ping you when Bitcoin approaches your levels. By the end, you’ll have a blueprint for turning TradingView into a coherent Bitcoin analysis station rather than a random set of charts and watchlists.
Why Bitcoin Traders Gravitate to TradingView
At its core, Bitcoin TradingView provides clean, responsive charts with multiple data sources and timeframes, plus advanced drawings like trendlines, Fibonacci tools, and volume overlays. The platform’s scripting language, Pine Script, lets you convert ideas into code so you can test them on historical BTC data and analyse results with built-in performance reports. TradingView calls these “strategies,” and they simulate trades across historical and real-time bars to backtest and forward-test your rules before risking capital.
Another major draw is alerting. Instead of staring at a screen, you can set alerts tied to price, indicators, strategies, or even drawings. These alerts run on TradingView’s servers continuously, so they trigger even when your browser is closed—perfect for fast-moving Bitcoin markets that trade around the clock.
Finally, if you prefer a one-stop workflow, you can connect select brokers directly to TradingView and place orders from the chart. TradingView actively supports broker integrations, maintaining documentation and endpoints to standardise connectivity. While availability varies by region and asset class, the intent is clear: analysis and execution in one interface.
Building a Bitcoin Chart That Works for You

Choosing the Right BTC Symbols and Timeframes
When you start with Bitcoin TradingView, search for BTCUSD, BTCUSDT, or exchange-specific pairs. For swing trading, daily and 4-hour charts often reveal the prevailing trend and key levels. For intraday focus, 15-minute or 5-minute charts expose micro-structure like pullbacks and breakouts. Create a layout with multiple panes to compare timeframes and confirm structure at a glance. As a rule of thumb, anchor your bias on a higher timeframe and refine triggers on a lower one to avoid overtrading noise.
Core Indicators: Moving Averages, RSI, and MACD
Start lean. A pair of moving averages can help you visualise trend direction and dynamic support/resistance. Combine that with RSI to gauge momentum extremes and MACD to highlight trend acceleration or loss of steam. Keep the signals contextual: an RSI “overbought” in a strong uptrend can stay elevated while price grinds higher. On Bitcoin TradingView, you can adjust lengths, smoothing, and sources quickly from the indicator settings dialogue, then save your setup as a template you can load on any BTC chart.
Drawing Tools and Levels
Use trendlines, channels, and Fibonacci retracements to map structure and potential reaction zones. Mark prior swing highs/lows and session opens, then watch how the price behaves there. Consolidations at key levels often precede expansion; rejection wicks tell you where supply or demand absorbed orders. The utility of Bitcoin TradingView here is visual clarity: drawings are snappy, easy to adjust, and sync across devices when you’re logged in.
Alerts: Your 24/7 BTC Sentry
Creating Price, Indicator, and Strategy Alerts
Alerts are a marquee feature of Bitcoin TradingView. You can create alerts on raw price, indicator plots, strategy signals, or even drawing objects. This means you can get notified when Bitcoin taps a trendline, when RSI crosses a threshold, or when your Pine strategy fires a long or short. Crucially, TradingView alerts run server-side, so they trigger without your browser being open. Set your conditions, choose frequency (once or every time), attach a message, and select delivery via app, email, or other supported notifications.
Practical Alert Framework for BTC
Create a tiered alert system. Tier one monitors higher-timeframe levels such as daily demand/supply zones. Tier two watches tactical triggers like a moving-average crossover or an RSI reset on the 15-minute chart. Tier three confirms momentum with MACD crossing its signal line on the execution timeframe. In a choppy BTC session, this layered approach helps you filter lower-quality signals while keeping you plugged into the moves that matter.
Pine Script: Turn Your Bitcoin Ideas Into Testable Code
What Strategies Are and Why They Matter
In Pine Script, a “strategy” is code that places simulated orders, enabling you to backtest rules on historical BTC candles and forward-test in real time. You can analyse a strategy’s equity curve, win rate, drawdown, and per-trade statistics to see if an idea holds water before you deploy it. TradingView’s documentation explains that strategy scripts can place, modify, and cancel hypothetical orders, with performance analytics displayed in the Strategy Tester. This is your scientific method for Bitcoin TradingView: hypothesize, test, measure, iterate.
A Simple Example to Spark Your Workflow
Suppose you want to test a 200-period SMA trend filter with RSI pullbacks. In Pine Script, you’d define the SMA, require price above it to allow longs, and only trigger when RSI dips below a chosen level and then recovers. Even basic examples like this teach you how entries, exits, stops, and position sizing interact on BTC. Community write-ups illustrate how to scaffold simple strategies and interpret results so you can avoid common backtesting pitfalls.
Best Practices for Backtesting Bitcoin on TradingView
Keep your assumptions realistic. Account for fees and slippage, avoid repainting indicators, and test multiple market regimes—ranging, trending, and volatile conditions alike. Consider forward-testing on a live BTC chart using the same rules but with real-time alerts rather than immediate execution. TradingView’s official Pine Script manual is the best reference as you add complexity like pyramiding, partial exits, and time-based filters.
From Analysis to Execution: Closing the Loop
Paper Trading and Broker Connectivity
Once a strategy shows promise, graduate from historical tests to paper trading to rehearse execution without financial risk. If you want to execute through TradingView’s interface, check the list of supported brokers and connection notes. The platform maintains broker integration resources and endpoint requirements to standardise order placement, positions, and quote streams. For Bitcoin, availability depends on the broker and jurisdiction, so verify instrument support and fees before connecting accounts.
Building a Bitcoin Trading Routine
Structure beats impulse. Start with your higher-timeframe BTC overview, mark levels, and log your plan. Set the alerts that correspond to your triggers and invalidate the setup when conditions break down. After the session, review trades against your rules and update your Pine strategy if you spot systematic weaknesses. With Bitcoin TradingView, this loop—plan, alert, execute, review—can live in a single environment.
Advanced Workflows for Bitcoin on TradingView

Multi-Timeframe Confirmation and Layouts
Leverage multi-pane layouts to stack daily, 4-hour, and 15-minute charts. Use a trend filter like a higher-timeframe EMA or ADX, and require the lower-timeframe signal to align before taking action. Save the layout so your drawings persist across sessions. Many BTC reversals start as divergences on lower timeframes while the higher timeframe stalls at a level; a persistent layout makes these handoffs easier to spot.
Strategy Alerts for Semi-Automation
You can attach alerts to your strategy signals so TradingView notifies you whenever the code’s conditions fire. This effectively “semi-automates” monitoring: you still manually execute, but the heavy lifting of scanning is handled server-side. Documentation and guides walk through how strategy alerts work and how to create them from your script or from the Strategy Tester’s interface, depending on your design.
Data Considerations: Symbols, Sessions, and Testing Windows
Be precise about which BTC market your strategy targets—spot vs. perpetuals, USD vs. USDT pairs—and match the test window to that market’s structure. Crypto trades 24/7; if your code assumes session opens/closes, ensure your logic accounts for continuous trading or defines pseudo-sessions. When you compare backtests, keep symbol, timeframe, and history consistent so you’re evaluating like for like. TradingView’s strategy docs emphasise reproducibility and understanding what your code is actually simulating.
Common Mistakes to Avoid with Bitcoin TradingView
Over-Optimizing Indicators
Traders often tweak parameters until backtests look stunning, only to watch performance crumble live. Resist curve-fitting. Instead of perfect results for the last six months, aim for robust performance across varied BTC conditions. Validate on an out-of-sample period and forward-test with alerts before going live. TradingView’s manuals and community examples repeatedly highlight this scientific approach to testing.
Ignoring Execution Friction
Bitcoin’s liquidity shifts with time of day, funding cycles, and event risk. Your Bitcoin TradingView backtest must include realistic fees and slippage. A strategy with a marginal edge can flip negative once you factor in costs. Use Pine’s inputs for commission modelling, and prefer fewer, higher-quality trades over hyperactive scalping unless you’re confident in your fills. The goal is durable edge, not impressive but fragile stats.
Relying on Signals Without Context
Indicators are maps, not the territory. Combine them with price action at meaningful levels, watch how BTC responds to liquidity pools like prior highs/lows, and let alerts summon you when real context emerges. On Bitcoin TradingView, discipline comes from your plan, not a flashing arrow.
A BTC Playbook You Can Repeat
The magic of Bitcoin TradingView isn’t any single indicator; it’s the way charts, alerts, and Pine strategies fit together. You can design a weekly routine that starts with a macro sweep of BTC trend and key levels, moves into indicator-based triggers with strict rules, and is enforced by server-side alerts so you don’t miss the setup. When the alert fires, you consult your playbook, execute if conditions are met, and log the outcome. Afterwards, you feed those observations into your Pine tests, refining entries, exits, and filters. Over time, this creates a feedback loop where your BTC trading evolves from intuition to a measurable process.
Also Read: Bitcoin Real Time Price Live Updates & Market Insights 2025
Conclusion
Bitcoin TradingView gives individual traders access to a professional toolkit: world-class charts, flexible indicators, Pine Script for systematic thinking, a strategy tester for backtests, and 24/7 alerts that keep you connected even when you’re away from the screen. Used thoughtfully, it can anchor your entire BTC workflow—from planning and monitoring to reviewing and iterating—without overwhelming you with noise. Start simple, codify your ideas, and let TradingView’s server-side infrastructure and documentation do the heavy lifting in the background while you focus on decision quality. With a structured routine and honest testing, your Bitcoin analysis can become clearer, faster, and more consistent.
FAQs
Q: What’s the fastest way to get useful alerts on Bitcoin TradingView?
Begin by marking your daily and 4-hour BTC levels, then create price alerts slightly before those zones so you have time to assess. Add a second alert tied to a confirming indicator like RSI or a moving-average crossover on your execution timeframe. TradingView supports alerts on price, indicators, drawings, and strategies, and they run on servers 24/7, so you won’t miss a trigger.
Q: Can I backtest my Bitcoin strategy on TradingView?
Yes. Write your rules as a Pine Script strategy, apply it to a BTC chart, and review the Strategy Tester’s performance metrics. Strategies simulate orders on historical and real-time bars, letting you backtest and forward-test before risking capital.
Q: Do I need to keep my browser open for TradingView alerts to work?
No. TradingView alerts are server-side, which means they trigger even when you’re logged out or your computer is off. You choose how to be notified, including app and email.
Q: Is it possible to execute Bitcoin trades directly from TradingView?
In some cases, yes. TradingView provides broker integrations that allow in-chart trading with supported brokers. Availability varies by broker and region, so check the broker’s page and integration details for specifics.
Q: Where can I learn Pine Script for Bitcoin TradingView from scratch?
Start with the official Pine Script® User Manual for language basics, concepts, and examples. From there, explore strategy documentation and community tutorials that show end-to-end backtesting workflows for BTC.