Bitcoin Price Watch Bearish Clouds Still Loom
Bitcoin trades in a tight range as bearish signals persist. See key levels, on-chain trends, and what could break BTC’s stalemate.
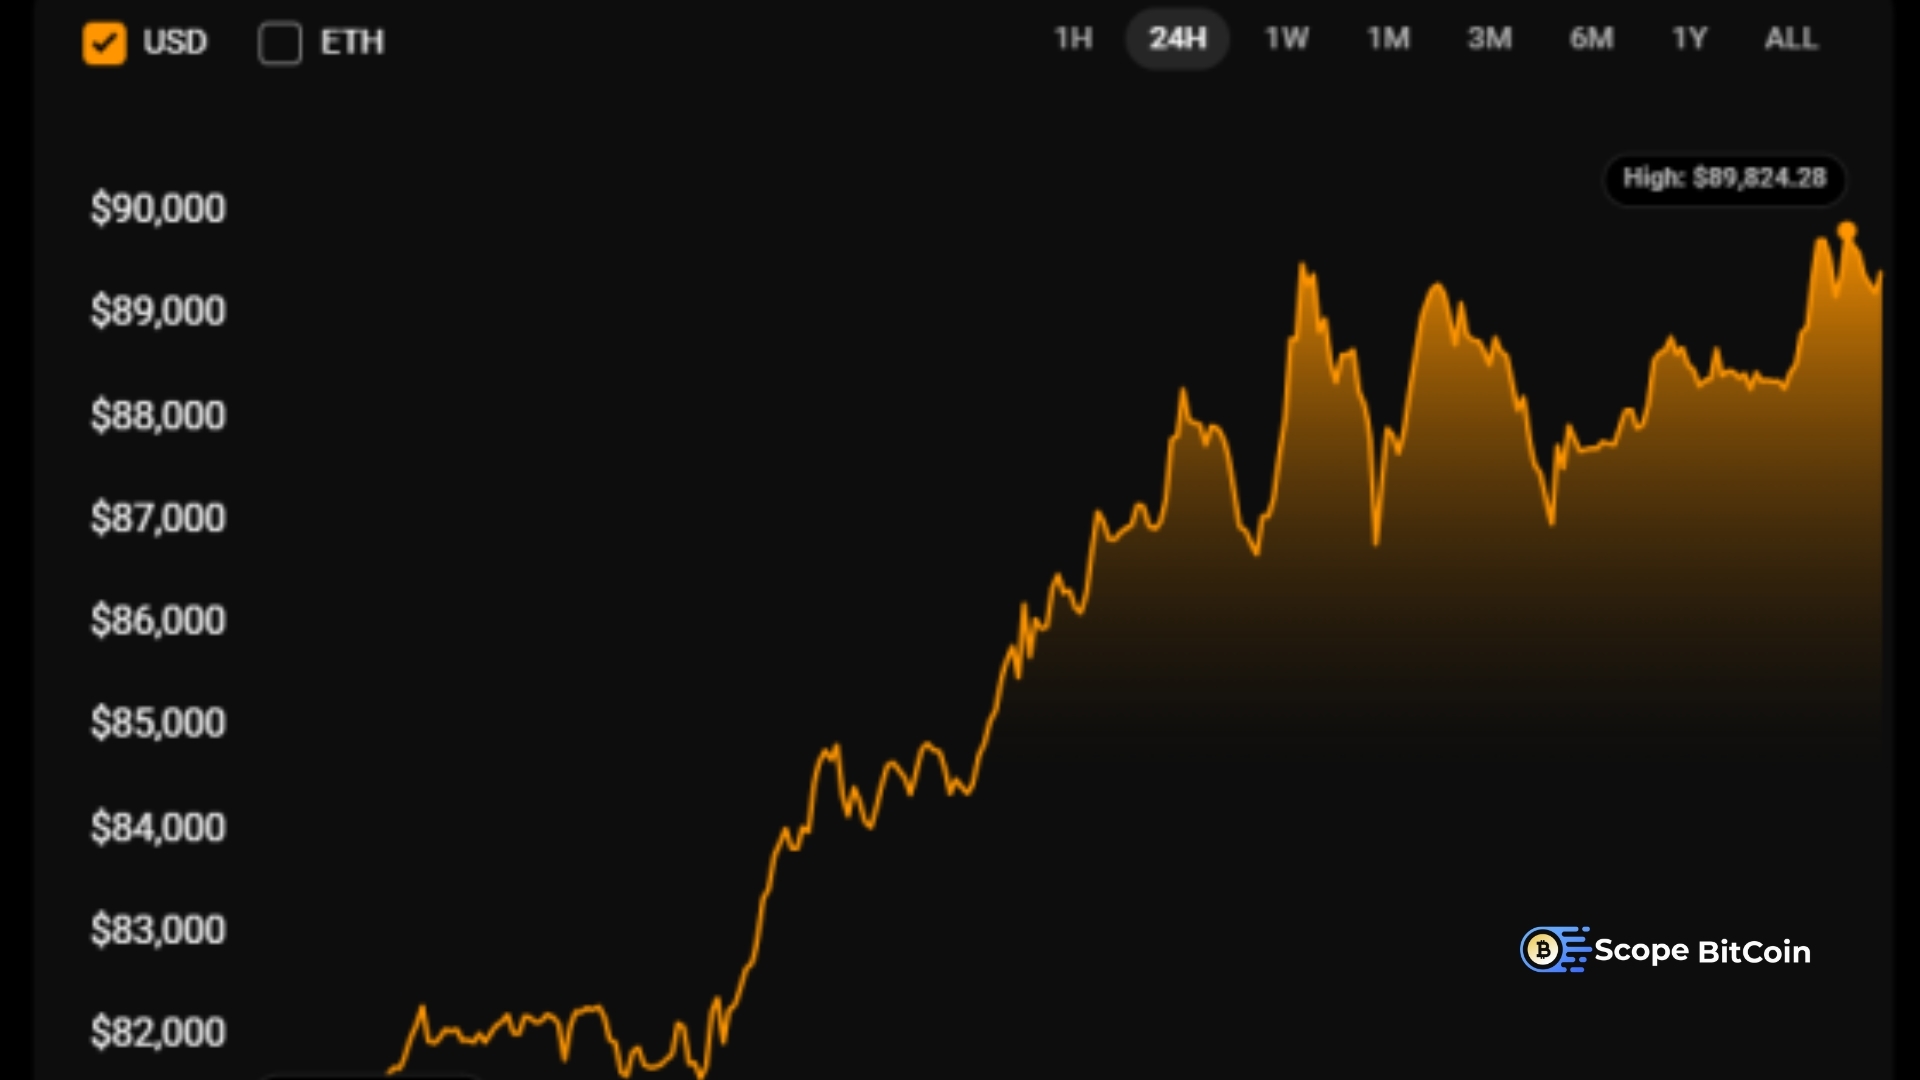
The Bitcoin price has been caught in a frustrating stalemate, oscillating within a narrow band while traders debate whether the next decisive move will be a breakout or a breakdown. This kind of rangebound action can lull markets to sleep, but beneath the surface, there are currents worth watching. From declining liquidity pockets to shifting derivatives positioning, the market is quietly rebalancing after months of volatility.
The presence of bearish clouds doesn’t automatically signal a collapse, yet the absence of strong bullish momentum suggests caution. In this in-depth Bitcoin price watch, we’ll unpack the structure of the range, the key support and resistance levels, the behavior of long-term holders, and the catalysts that could finally jar BTC out of its sideways shuffle.Our aim is to replace fear or FOMO with context.
By studying the market structure, on-chain indicators, and macro cross-currents, traders can build a framework for navigating the current environment. Whether you’re a short-term scalper or a long-term accumulator, understanding why Bitcoin is rangebound and what might end that range is essential.
Why Bitcoin Is Stuck in a Range
A range forms when buyers and sellers reach a temporary truce. In Bitcoin’s case, dip buyers anchor the lower boundary while profit-takers and short sellers patrol the upper bound. Neither side has mustered the conviction or liquidity to steamroll the other. This equilibrium often follows a period of trend exhaustion, when the marginal buyer steps back and the marginal seller isn’t ready to capitulate. The result is sideways price action with occasional false breakouts that snap back into the range.
Under the hood, several dynamics reinforce the stalemate. Liquidity providers cluster limit orders around obvious levels, which both magnetizes and defends the range. Volatility sellers thrive in this environment, selling options and dampening realized volatility. Meanwhile, spot market flows remain tepid as retail interest cools and institutions wait for better risk-reward. Add to that a macro backdrop of mixed economic data and shifting risk appetite, and you have a recipe for consolidation.
Reading the Current Market Structure
Market structure tells the story in price. On higher time frames, Bitcoin’s trend remains broadly constructive as long as prior swing lows hold, but the shorter time frames show a series of lower highs pressing against a flat or slightly rising support. That combination is where the phrase bearish clouds becomes relevant: sellers are leaning in, even if they haven’t yet forced a breakdown. The range’s midline—often the 50% retracement of the latest impulse—acts like a balance point. Sustained acceptance above that midline tends to invite tests of resistance; failure to recapture it warns of pressure building toward support.
Traders should pay attention to the 200-day moving average, the weekly VWAP, and the most recent point of control (POC) from volume-profile analysis. When price churns below VWAP and struggles near the POC, it implies the market is comfortable transacting at these levels, sapping the urgency that fuels trend.
Support and Resistance That Matter Now

Support is not a line—it’s a zone. For Bitcoin’s current range, the lower boundary is defined by a cluster of prior lows, the top of a previous consolidation, and a patch of high-volume nodes that absorbed heavy selling. The upper boundary corresponds to a shelf left by failed breakout attempts and the underside of a broken trendline. In between sits a contested mid-range where momentum traders repeatedly lose conviction.
If buyers are to flip the narrative, they need to reclaim resistance, hold it as support on a retest, and build higher lows into the prior cap. Conversely, bears want to force a close below support, turn it into resistance, and accelerate into stops that have accumulated beneath the range.
On-Chain Signals What Holders Are Doing
One reason the Bitcoin price has refused to unravel is the resilience of long-term holders. Coins older than six months show slower turnover during ranges; these diamond hands act as a buffer, absorbing panic selling. That said, when prices approach resistance, there’s a measurable uptick in realized profit—older coins move to exchanges to be sold, creating supply overhead that restrains rallies.
Dormancy and mean coin age metrics help identify whether older supply is awakening. If dormancy rises sharply into resistance, that’s a classic sign of distribution. Conversely, if transfer volume remains dominated by younger coins while exchange balances decline, it suggests accumulation and a foundation for bullish continuation once the range resolves.
Another lens is the MVRV ratio (market value versus realized value). When MVRV sits near neutral, it often coincides with consolidation. Extremes—hot or cold—tend to appear ahead of trend changes. The current neutrality aligns with the thesis that rangebound price action can persist until a new narrative or liquidity shock arrives.
Derivatives: Hidden Leverage and Liquidation Pools
Futures and options can either amplify or anesthetize spot moves. During a range, two opposing tendencies matter. First, basis (futures premium/discount) tends to compress toward spot, signaling reduced speculative appetite. Second, open interest can quietly climb as traders sell premium and harvest funding, building a tinderbox of liquidation levels near the range edges.
When price pokes the boundary, short-dated options delta-hedging can exacerbate the move. If calls are heavily sold near resistance, a fast run-up forces hedgers to buy spot, fueling a squeeze. Similarly, if puts crowd the lower band, a sharp drop can snowball as hedgers sell spot to stay neutral. This is why bearish clouds can linger without immediate collapse: derivatives structure suppresses volatility—until it doesn’t.
Macro Cross-Currents The Wind at Bitcoin’s Back—or Face
Bitcoin doesn’t trade in a vacuum. Real yields, the dollar’s trend, and equity risk sentiment all shape BTC’s path. Rising real yields and a firm dollar typically pressure risk assets, while dovish policy, softer yields, and liquidity injections are tailwinds. Regulatory headlines add another layer, affecting institutional flows, ETF demand, and compliance risk for exchanges. When macro is foggy, markets often consolidate, waiting for clarity from central banks, inflation prints, or fiscal policy shifts.
Psychology of a Range Why It Feels Harder Than It Is
Ranges are deceptively challenging. Traders get chopped by false breaks, over-trade the midline, or pre-empt a breakout with over-sized risk. The antidote is process. Define the range objectively, refuse to chase mid-range moves, and wait for price to trade into your levels. Decide in advance whether you are a mean reversion participant—fading the edges—or a breakout participant who waits for confirmation. Mixing both approaches in a single plan often leads to hesitation and losses.
Strategy Playbook for Rangebound Bitcoin
Mean reversion approach: Traders identify the lower boundary as a buy zone when momentum wanes and seller exhaustion appears. They target the midline first, then trail toward the upper boundary if conditions improve. Risk is defined by a clean invalidation below support. Patience is critical; entries taken too early turn a good idea into a stubborn loss.
Breakout approach: Traders ignore the churn and focus on acceptance outside the range. A convincing break features rising volume, strong close beyond the level, and follow-through in the next session. Pullbacks that hold the broken level as support offer higher-probability entries than chasing the first impulse. This approach reduces chop but requires discipline to wait.
Hybrid approach: Some traders scale small mean-reversion positions at the edges while reserving capital for a confirmed breakout. The key is position sizing and a strict rule against adding to losers.
Key Levels to Monitor Over the Next Move
Even in a generic framework, a few archetypal levels matter. The range low is the bull’s line in the sand. Beneath it sits an air pocket where stops cluster; if price flushes into that void, it can accelerate quickly. The range high is the bear’s fortress; acceptance above it converts trapped shorts into forced buyers. The midline is the battleground, often aligning with daily VWAP or a 50% retracement. If price can build a base above the midline and rotate higher with higher lows, the odds of a topside test increase.
Also Read: Bitcoin Price Near $100K What Comes Next
Liquidity and Order Flow Following the Footprints
Depth of book and executed volume tell you where traders really care. Thin books near the edges invite stop runs; thick books in the middle create gravity. Watching cumulative volume delta (CVD) can reveal whether aggressive buyers or sellers are in control. If price rises on flat or falling CVD, it can signal absorption—strong passive sellers capping the move. If price holds steady while CVD rises, passive buyers may be absorbing sells, laying the groundwork for a bounce.
Tape-reading is not about predicting every tick; it’s about recognizing when the character of the order flow changes. In ranges, character often shifts at the edges first.
Funding, Sentiment, and the Perils of Consensus
When everyone agrees Bitcoin is “boring,” the next big move often surprises. Funding rates drifting to zero reflect apathy, but a tilt toward persistent positive funding without price advancement can warn of soft longs primed for a shakeout. Conversely, negative funding that fails to push price down can precede a squeeze. Sentiment surveys and social chatter are noisy, yet extremes matter. Apathy at the lows is typical of accumulation; euphoria at the highs is typical of distribution.
Long-Term Thesis vs. Short-Term Tactics
It’s possible to be structurally bullish on Bitcoin while tactically cautious. A long-term thesis might center on digital scarcity, improving institutional adoption, and strengthening exchange-traded products, while a short-term view acknowledges bearish clouds and the risk of a deeper pullback before the next leg higher. The best operators separate time horizons. They accumulate strategically during value zones and trade tactically around well-defined levels.
The Only Edge That Compounds
In a range, risk management becomes your edge. Stop placement should reflect structure, not hope. If you’re fading the lows, an invalidation just beyond the wick extremes ensures that if the range breaks, you’re not the liquidity. If you’re trading breakouts, accept that failed breakouts happen; reversion back into the range is your signal to exit quickly. Keep leverage modest; ranges breed over-confidence until they abruptly don’t.
Sizing should expand after your approach proves itself in the current regime. When your last few trades at the range edges respect your system, you can scale thoughtfully. If you’re out of sync—late entries, early exits, or revenge trades—reduce size until the rhythm returns.
Catalysts That Could Break the Stalemate
Macro surprises: A significant shift in inflation data, a central-bank pivot, or a sudden move in real yields can jolt risk sentiment and spill over into crypto. Regulatory clarity or shocks: Green lights for new products or jurisdictions can unlock demand; enforcement actions against major entities can create forced selling. Liquidity events: Large-scale liquidations or a short squeeze can be the spark.
When open interest stacks up near the edges, it’s a coiled spring. Narrative ignition: Renewed interest in Layer-2 scaling, Bitcoin ordinals, or real-world asset tokenization can draw fresh flows into the ecosystem, reviving momentum.
What “Bearish Clouds” Really Mean
Describing the outlook as clouded doesn’t mean Bitcoin is doomed. It means the path of least resistance is not immediately higher until buyers prove otherwise. Bearish divergence on momentum indicators, selling into strength at resistance, and cautious funding all paint a picture of a market that wants more evidence. Clouds can clear quickly with a strong daily close above resistance and healthy follow-through. Until then, range trading remains the highest-probability framework.
Building a Plan for Multiple Scenarios
A good plan accounts for both directions:
If price breaks up: Look for weekly acceptance above resistance, constructive retests, and expanding spot volume. Favor pullback entries over chases. Watch whether long-term holders remain steady; if old coins stay quiet, the rally has sturdier legs.
If price breaks down: Expect a fast run into liquidity beneath the range. Prepare levels where you will look for seller exhaustion—long lower wicks, trapped shorts, and absorption on the tape. Be ready to step aside if the breakdown evolves into a trend; fighting momentum is expensive.
In both cases, your plan should specify entries, invalidations, and profit-taking zones. This turns uncertainty into actionable triggers rather than emotional guesses.
Investor Perspective Dollar-Cost Averaging in a Range
For investors rather than active traders, ranges are opportunities. Dollar-cost averaging (DCA) reduces timing risk and uses consolidation to your advantage. Define a schedule, automate it if possible, and resist the urge to micromanage. If the range breaks lower, your scheduled buys add exposure at a discount; if it breaks higher, you already have a base position. Overlaying DCA with a simple risk guard—such as reducing purchases if price accelerates parabolically—helps avoid buying frenzies.
Technical Confluence Where Signals Agree
The best levels are where signals converge. If a Fibonacci retracement, a prior weekly close, and a volume node all align, that zone earns your focus. Add a moving average cluster—for example, the 50-day and 200-day moving averages—and you have a confluence worth planning around. During ranges, confluence zones often sit just outside the boundaries, becoming launchpads for breakouts or traps for the impatient.
Narrative Discipline: Separating Noise from Edge
Crypto discourse moves fast. Every tweet can feel like a catalyst, but most are noise. Anchor your view in price structure, on-chain trends, and liquidity. Let price confirm or deny narratives. When headlines claim “institutional wave incoming,” look for it in spot volume, ETF flows, and exchange balances. When fear spreads about miner capitulation, check hash rate, miner reserves, and sell pressure. The market rewards those who measure rather than react.
Conclusion
The Bitcoin price is coiling within a defined range, and bearish clouds remain until buyers reclaim and hold resistance with authority. Underlying on-chain signals are mixed but stable, derivatives positioning is suppressing volatility while storing energy, and macro winds are variable. This is a market that rewards patience, precision, and humility. Keep your plan simple: respect the range, define your invalidations, and let price prove the next chapter. Whether the coming move is a clean breakout or a capitulation wick, those who planned will recognize it—and act without hesitation.
FAQs
Q: Why does Bitcoin often go sideways after big moves?
After a strong trend, markets need to rebalance. Liquidity redistributes, profits are taken, and new buyers or sellers wait for better prices. This creates sideways price action where neither side has the conviction to force continuation, resulting in a range.
Q: What signals indicate a breakout has real momentum?
Look for a daily or weekly close beyond the range, rising spot volume, expanding open interest that follows price, and successful retests that hold above the broken level. If options markets flip from selling premium to chasing delta, that confirms momentum.
Q: How should I set stops when trading a range?
Place stops where your idea is invalid, not where you fear losing money. For fades at support, an invalidation sits just beyond the structure—beneath wick extremes or the lowest cluster of the range. For breakouts, a stop belongs just back inside the range if acceptance fails.
Q: Do on-chain metrics really help short-term trading?
On-chain data is slower than intraday tape but invaluable for context. Rising dormancy, increasing exchange inflows, and spikes in realized profits near resistance suggest distribution. Declining exchange balances and steady long-term holder supply favor accumulation.
Q: Is dollar-cost averaging sensible during ranges?
Yes. Ranges offer predictable volatility and reduce timing risk for investors. A disciplined DCA plan builds exposure gradually, allowing you to benefit whether price breaks higher or gives a final discount lower before the next trend emerges.