Bitcoin On Chain Analysis: Guide to Understanding Market Trends
Bitcoin On Chain Analysis: The digital asset market is still dominated by Bitcoin (BTC), the first and largest cryptocurrency in the world. In 2024, on chain analysis became essential for traders and investors who wanted to understand Bitcoin’s behaviour better and make better decisions. By providing a glimpse into the real action of the Bitcoin blockchain, on-chain measurements allow us to go beyond typical market statistics such as price and volume. In this in-depth article, Learn about on chain analysis, why it matters, and which indicators will be most important to track in 2024.
What Is On-Chain Analysis?
The goal of conducting on chain analysis is to learn about the actions of Bitcoin network nodes by looking at data stored on the blockchain. Among the many pieces of data it supplies are transaction volumes, wallet-to-wallet coin transfers, mining activity, and network fees. The blockchain technology behind Bitcoin is visible and unchangeable, in contrast to the sometimes secretive nature of data in conventional financial systems. This makes all past transactions publicly available, which analysts can use to spot patterns, predict actions, and predict how the market will behave.
Combining on-chain analytics with other tools for fundamental and technical analysis is common practice. While volume and price charts show how the market feels on the surface, on-chain analytics show how the market is moving.
Key Metrics in On Chain Analysis
Hash Rate
Miners employ a certain amount of computing power, known as the hash rate, to verify Bitcoin transactions and keep the network secure. When the hash rate is high, the network is secure and robust, making double-spending and other assaults by bad actors very difficult to execute.
As more and more people join the Bitcoin network and purchase powerful mining gear, the hash rate has been steadily climbing since 2023 and has reached new highs in 2024. The widespread consensus is that miners are bullish on Bitcoin’s long-term worth since the increasing hash rate. On the other hand, a dramatic decline in hash rate may indicate regulatory crackdowns or energy price rises, both of which can cause havoc in the mining ecosystem.
Active Addresses
A wallet’s “active addresses” are the total addresses currently involved in Bitcoin transactions. This metric can measure the amount of activity on the Bitcoin network. An increase in active addresses indicates more people using and interested in Bitcoin. In contrast, a fall can mean fewer people using it or investors are tired of it.
In 2024, the number of active addresses has been rather consistent, with small increases that reflect high prices or news events. As more and more businesses and individuals accept Bitcoin as a legitimate investment option, the number of active wallets has increased. Since increasing addresses do not always indicate positive market sentiment, analysts often examine active address trends with other data.
Transaction Volume
The volume of transactions measures the overall quantity of Bitcoin transmitted over the network in a specific period. You can see how much money is changing hands on the blockchain by looking at this statistic. Low transaction volumes may indicate a period of market consolidation or dormancy, whereas high numbers imply increased trading or payment activity.
In 2024, institutional and retail buyers continue to fuel Bitcoin’s transaction volume, which experiences huge surges at extreme market volatility. In particular, institutions have grown in using Bitcoin, which they employ for treasury management, trading, and asset storage. Inflation, interest rate hikes, and geopolitical events are examples of macroeconomic variables that might impact transaction volume.
Realized Price
Essential to any on-chain measure, realized price determines the average price at which all Bitcoin in circulation was last traded. Factoring in the price at which holders purchased or transferred their coins paints a more realistic image of Bitcoin’s present value.
Market participants have been attentively monitoring the realized price of Bitcoin in 2024 to ascertain phases of accumulation or distribution. There may be more pressure to sell Bitcoin if its market price is higher than its realized price since this indicates that most holders are making a profit. On the flip side, if the realized price is lower than the market price, holders often lose money, which could lead to accumulation in the long run.
HODL Waves
You can see how long various UTXOs (Unspent Transaction Outputs) are held by using the HODL Waves visualization tool. Analysts can discover patterns in investor behaviour by dividing Bitcoin holders into cohorts according to the amount of time they have owned the cryptocurrency.
As HODL Waves has demonstrated in 2024, long-term holders (those who have kept Bitcoin for over a year) maintain market dominance, even during market slumps. Many see this statistic as a positive indicator since it shows that these investors are bullish on Bitcoin’s long-term potential and are hesitant to sell despite temporary price swings. However, short-term holders are likelier to sell price gains, which adds to the market’s volatility.
Exchange Balances
The total value of Bitcoins on centralized cryptocurrency exchanges is the exchange balance. A possible indicator that investors are getting ready to sell is a large amount of Bitcoin being transferred to exchanges. On the flip side, investors who move their Bitcoin holdings out of exchanges and into private wallets are likely doing so with an eye toward the future.
As more Bitcoin is transferred out of exchanges and into cold storage or custodial solutions, the drop in exchange balances has been consistent until 2024. If this trend continues, there will likely be less short-term selling pressure and more confidence among holders. More Bitcoin is being locked into different decentralized finance (DeFi) protocols, reducing exchange balances as deFi continues gaining acceptance.
MVRV Ratio (Market Value to Realized Value)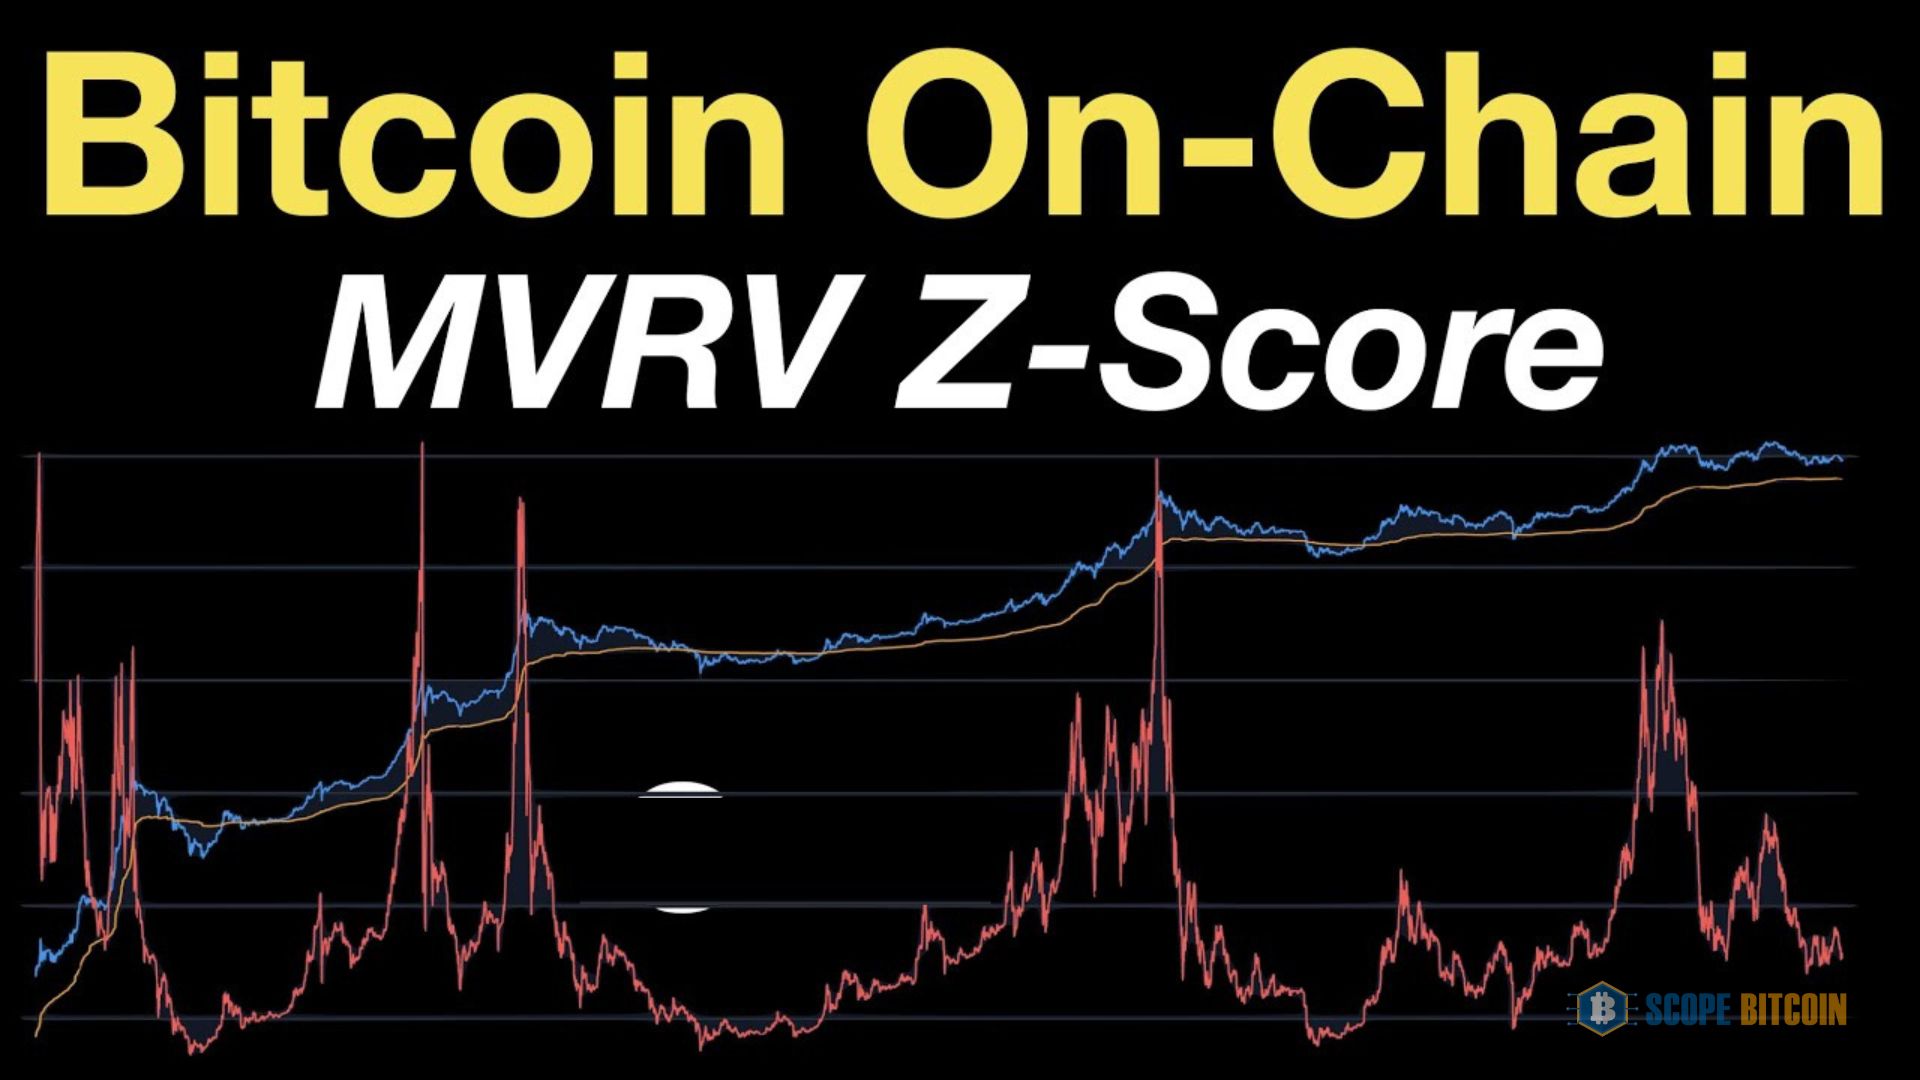
The MVRV ratio analyzes Bitcoin by contrasting its market cap with its realized cap. This metric is utilized to determine if Bitcoin is overpriced or underpriced in terms of its price history. If the MVRV ratio is more than 1, Bitcoin is being sold at a premium to its realized value, whereas a ratio lower than 1 means that it is being sold at a discount.
With Bitcoin’s ups and downs in price in 2024, the MVRV ratio has been all over the place. The MVRV ratio is a positive indicator that tends to climb during prolonged price growth. Conversely, a buy signal appears when the MVRV ratio falls below 1, suggesting that Bitcoin is trading at a discount to its average price over the past year.
Whale Activity
Whales, or huge Bitcoin holders, significantly influence the market dynamics. Since the buying and selling actions of these major holders can substantially influence the price of Bitcoin, on chain analysis follows their movements.
Whale behaviour will continue to be an important indicator to track in 2024. The price of Bitcoin can fluctuate wildly due to large transactions that involve hundreds or thousands of bitcoins. When whales transfer Bitcoin to exchanges, it can be a sign of impending selling pressure, thus analysts keep a careful eye on their every move. Because whales are typically investors with a long-term perspective, their accumulation during declines is a warning that the market is about to bottom out.
Conclusion
On chain analysis is becoming a must-have instrument for making sense of Bitcoin market movements. Investors can learn more about the market structure and possible price fluctuations of Bitcoin by looking at important data, including hash rate, transaction volume, realized price, and whale behaviour. With Bitcoin’s further development, on-chain data is expected to have an even bigger impact on investing strategies in 2024 and beyond. Thanks to the immutability of the Bitcoin network, on chain analysis has emerged as a potent tool for gaining insights inaccessible in more conventional financial markets.