
Bitcoin Price USD Today’s Trends & Smart Insights
Track the Bitcoin price USD with expert insights on drivers, forecasts, and strategies. Learn fundamentals, on-chain clues, and risk management.
The phrase “Bitcoin price USD” is one of the most searched combinations in crypto, and for good reason: it compresses a decade of monetary experiments, market narratives, and real-time speculation into a single number. That number moves for reasons both simple and subtle—liquidity flows, macro interest rates, institutional adoption, regulatory headlines, and the coded heartbeat of Bitcoin’s own halving cycle.
This guide digs deep into how the Bitcoin price in USD forms, why it swings, and what seasoned observers look at when they try to make sense of the chart. You’ll learn the essentials of market microstructure, the role of on-chain metrics, key technical analysis tools, and the macro backdrop that often sets the tone for every risk asset, Bitcoin included. Throughout, we’ll keep the discussion practical, so you can read the Bitcoin price USD not as a random ticker but as a living story with causes and consequences.
What Bitcoin Price USD Really Means
The Bitcoin price USD is the last traded price of one bitcoin quoted in United States dollars on a given venue. Because Bitcoin trades on hundreds of exchanges, no single source is “official.” Instead, major data providers compute a blended index that smooths out outliers and thin order books.
When you pull up the BTC to USD chart on a mainstream platform, you’re usually seeing such a composite. In liquid hours, spreads are tight and cross-venue prices converge quickly. During periods of stress, the gap between venues can widen, and flash dislocations occur on exchanges with shallow order books.
This plurality of venues has benefits. It reduces single-point failure risks and provides arbitrage opportunities that anchor prices across platforms. It also means that the Bitcoin price USD you see in a news headline is a snapshot, not a decree; it’s a negotiated value formed by bids and asks across global markets.
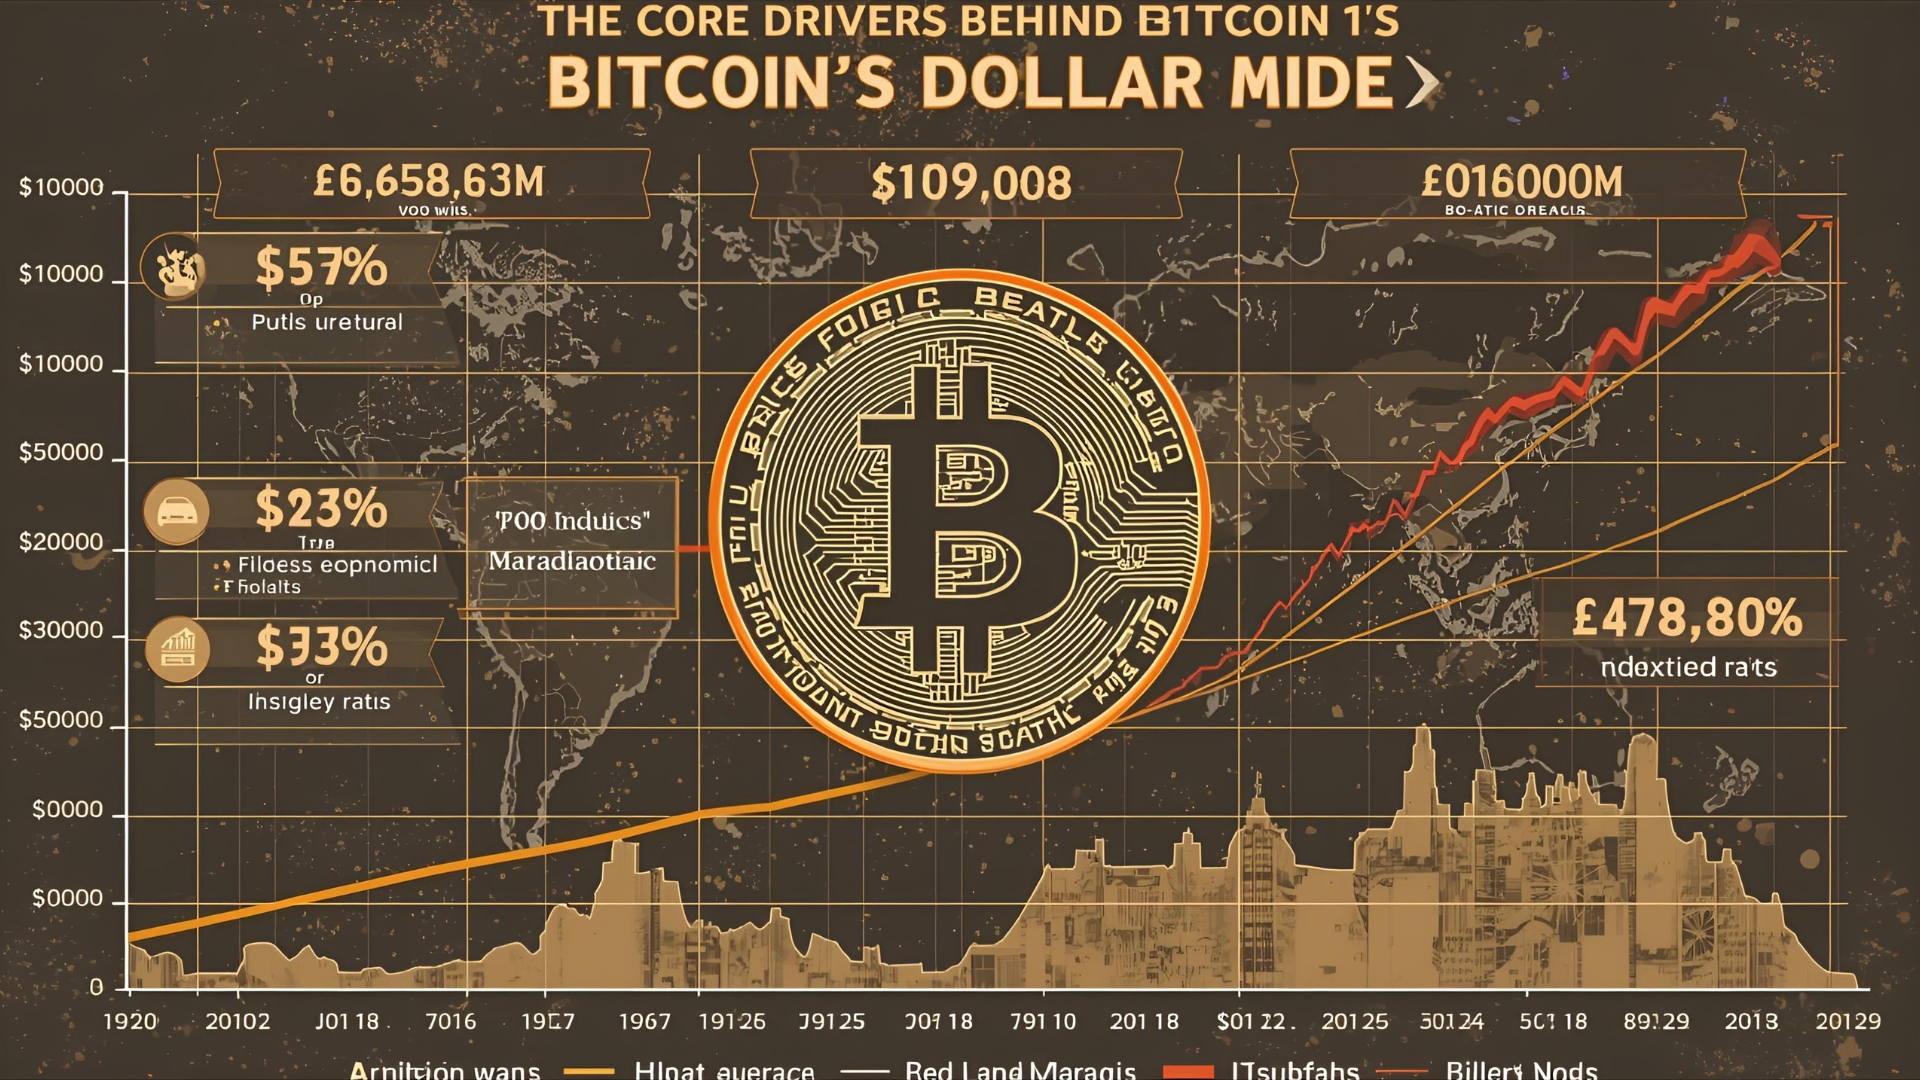
The Core Drivers Behind Bitcoin’s Dollar Price
Liquidity and the Cost of Money
The most consistent gravitational force on the Bitcoin price USD is global liquidity. When central banks lower rates or pause tightening, risk assets breathe easier. Rising real yields, by contrast, increase the opportunity cost of holding volatile assets with no cash flow.
Bitcoin’s advocates pitch it as digital gold and an inflation hedge, yet in practice, the asset often behaves like a high-beta macro instrument during tightening cycles. The interplay of Treasury yields, DXY (the U.S. Dollar Index), and equity risk appetite creates a macro current that Bitcoin tends to follow, even as its long-term thesis is independent of central bank policy.
Regulation and Institutional Adoption
The Bitcoin price USD is acutely sensitive to regulatory signals. Clearer rules in major jurisdictions lower perceived risk and open the door to institutional adoption.
Milestones like spot ETF approvals, clearer custody frameworks, or bank-grade infrastructure are accelerants because they connect Bitcoin to traditional capital pools. Conversely, enforcement actions, exchange shutdowns, or adverse tax rules can compress liquidity and dent confidence.
Halving and On-Chain Fundamentals
Bitcoin’s supply issuance halves roughly every four years. This halving schedule is widely known, but its market impact still shows up because it affects miner revenue, selling pressure, and narrative momentum. Analysts often track hash rate, difficulty, miner balances, whale accumulation, and HODL waves to infer if supply is getting tighter or looser in practice. Strong on-chain metrics—rising active addresses, increasing long-term holder supply, and a robust fee market—tend to support the Bitcoin price USD over multi-quarter horizons, even if short-term volatility remains intense.
Exchange Microstructure and Derivatives
Spot flows are only half the story. On perpetual swap venues, funding rates reveal whether longs or shorts are paying to hold positions. Elevated positive funding often signals froth, while persistently negative funding can indicate fear or hedging demand.
Rising open interest amplifies moves; crowded leverage makes liquidations more violent and pushes the Bitcoin price USD through cascading stops. Watching liquidity pockets, order book depth, and delta skew across options markets offers clues about where traders expect turbulence.
Reading the Chart Practical Technical Analysis
Support, Resistance, and Market Memory
The simplest map for the Bitcoin price USD is built from support and resistance. Former highs and lows mark zones of memory where traders previously capitulated or got trapped. When price re-enters these zones, behavior rhymes: breakouts need volume to stick; retests decide whether a level flips from resistance to support. Observers draw supply and demand zones, trendlines, and channels to contextualize the next likely battle.
Moving Averages and Momentum
The 50- and 200-day moving averages are widely watched. A “golden cross” (50-day crossing above the 200-day) boosts sentiment, while a “death cross” does the opposite. Tools like RSI and MACD help gauge momentum and potential exhaustion.
In sharp uptrends, RSI can remain elevated longer than seems reasonable; in downtrends, oversold conditions can persist. The goal is not to predict the exact next tick of the Bitcoin price USD, but to assess whether the prevailing impulse has room to run or is getting tired.
Volume, Market Profile, and Liquidity Gaps
Volume confirms conviction. Breakouts on weak volume are fragile; high-volume moves often define important pivots. Some traders use Volume Profile to spot high-volume nodes (acceptance areas) and low-volume nodes (liquidity gaps) where price may move quickly. When the Bitcoin price USD enters a low-volume pocket, it can traverse it rapidly until a new acceptance zone forms.
On-Chain Signals Most Traders Watch
Realized Price and Holder Cost Bases
The realized price—the average price at which all coins last moved—serves as an aggregate cost basis. In bull phases, the Bitcoin price USD tends to hold above realized price; in bears, price often dips below it, signaling broad unrealized loss. Layered cost bases for short-term and long-term holders reveal which cohort is under pressure or in control.
Exchange Flows and HODL Behavior
Rising exchange inflows from miners or whales can foreshadow increased sell pressure. Declining exchange balances often align with accumulation phases. HODL waves show coin dormancy; when older coins stay put, it implies conviction, limiting circulating supply. While none of these metrics guarantee the next move, together they sketch a supply-demand backdrop that shapes the Bitcoin price USD beyond daily noise.
The Narrative Machine Why Stories Move Price
Bitcoin is simultaneously technology, money, and movement, so narratives carry unusual weight. Themes like “digital gold,” “store of value,” “censorship resistance,” “banking alternative,” and “programmable collateral” ebb and flow with headlines.
Positive narratives—corporate treasuries adding BTC, a new country improving crypto rules, a major bank offering custody—expand the buyer base. Negative stories—exchange failures, hacks, harsh bans—shrink it. The Bitcoin price USD amplifies these stories through reflexivity: a rising price invites more attention and capital, while a falling price forces deleveraging and dampens belief.
Risk Management for a Volatile Asset
Volatility Is a Feature, Not a Bug
Bitcoin’s annualized volatility regularly outpaces equities and gold. That volatility is why the Bitcoin price USD can jump or drop by high single digits in a day and still reflect a healthy market. Position sizing is the first defense. Many investors treat Bitcoin as a high-risk sleeve, adjusting exposure so inevitable drawdowns won’t force emotionally driven exits. A common mistake is treating 5% daily swings as exceptional; they are not.
Time Horizon and Thesis Discipline
If your thesis is multi-year—say, adoption growth or halving-driven scarcity—then daily candles matter less. Short-term traders, on the other hand, live by levels, liquidity, and execution. The danger is mixing horizons: turning a trade into an “investment” after it goes against you, or cutting a long-term position because of a one-week pullback. Aligning horizon and thesis helps interpret the Bitcoin price USD with less noise.
Custody and Counterparty Risk
Price is only part of risk. Self-custody comes with operational responsibility; exchange custody introduces counterparty risk. Diversifying venues, using hardware wallets for long-term holdings, and enabling strong security features reduces the chance that a market drawdown is compounded by a loss of access. When headlines rattle confidence in a venue, outflows spike and spreads widen—mechanics that can jolt the Bitcoin price USD in the short run.
How Macroeconomics Filters Into Bitcoin
Inflation, Employment, and Central Banks
Inflation prints, jobs reports, and central bank meetings often set the tone for the week. Hot inflation or unexpectedly strong labor markets can revive rate-hike odds, lifting the dollar and pressuring the Bitcoin price USD. Conversely, disinflation and dovish guidance support risk.
Even if Bitcoin is ultimately orthogonal to fiat policy, the marginal buyer and seller price it in a fiat world, financing positions with fiat liquidity. That linkage means macro calendars matter.
The Dollar and Alternative Risk
A stronger DXY usually weighs on commodities and crypto, while a weakening dollar can act as a tailwind. Correlations are probabilistic, not permanent, but paying attention to them helps decode why the Bitcoin price USD sometimes reacts to events seemingly unrelated to blockchains. In times of global stress, cash becomes king, and even assets pitched as safe havens can see sharp outflows before they resume their own path.
Also read: Bitcoin Price index Live chart & USD Market cap
Case Studies How Price Reacts to Catalysts

ETFs and Regime Shifts
When spot ETF products open the gates to retirement accounts and institutions, they transform demand plumbing. If net inflows persist, they create a mechanical bid that supports the Bitcoin price USD, particularly during supply-constrained phases post-halving. The reverse is also true: if flows stall, the market must rely on organic demand, and price can correct to find it.
Exchange Failures and Sudden Shocks
Failures of major venues are the darkest catalysts because they blur fundamental value with trust erosion. In those episodes, liquidity fractures, on-chain data shows panic moves, and the Bitcoin price USD can gap down beyond typical ranges. Historically, survivorship has rewarded patient holders, but timing is uncertain, and the mechanical unwind of leverage can run longer than expected.
Building a Thoughtful Monitoring Routine
A Daily Dashboard That Actually Helps
A lean routine can keep you grounded without drowning in noise. Start with a reliable Bitcoin price USD index and compare it against the 50- and 200-day moving averages. Check the funding rate and open interest across major derivatives venues to sense leverage build-ups.
Glance at exchange net flows, miner balances, and a handful of on-chain health metrics such as active addresses and fees. Scan macro headlines for rate expectations and dollar strength. This minimalist dashboard keeps you aligned with both the micro and the macro that shape Bitcoin’s dollar price.
Interpreting Conflicting Signals
Markets are messy. You might see bullish on-chain accumulation but negative funding and a strong dollar. In those cases, think in layers. Long-term signals can coexist with short-term headwinds, and the Bitcoin price USD can oscillate between them. The goal is not certainty but context—knowing why price might be where it is and which forces could reasonably shift next.
Valuation Frames Beyond a Single Number
Stock-to-Flow, Network Effects, and Cash Flow Proxies
Bitcoin has no earnings, but it has scarcity and a network. Stock-to-flow models try to link scarcity to valuation; Metcalfe’s Law-style approaches tie value to the square of active users or addresses. Cash-flow proxies, like fees paid to miners and the value settled on chain, create fundamentals-adjacent anchors. None of these frameworks perfectly predict the Bitcoin price USD, yet each contributes a lens for thinking about fair value across cycles.
Relative Valuation and Risk Buckets
Some allocators evaluate Bitcoin by stacking it against other risk exposures: growth equities, emerging markets, and gold. In calm macro regimes, BTC’s asymmetry appeals; in stressed regimes, the same volatility becomes a liability. Thinking in buckets clarifies why the Bitcoin price USD sometimes behaves like a tech stock, sometimes like a commodity, and sometimes like a thing apart.
Strategy Ideas for Different Profiles
Long-Term Accumulators
For multi-year believers, dollar-cost averaging into Bitcoin reduces timing risk. Combining DCA with occasional adds on deep drawdowns can improve entry quality, provided you retain dry powder and adhere to risk limits. The Bitcoin price USD will swing; your edge is time in market, broad thesis alignment, and secure custody.
Swing and Position Traders
Swing traders focus on higher-timeframe levels, liquidity sweeps, and momentum. They may fade range extremes and ride trend continuations after breakouts with solid confirmation. A robust plan defines invalidation clearly, because the Bitcoin price USD punishes hesitation in fast conditions. Using options to define risk or capture volatility can complement spot positioning.
Yield-Seekers and Builders
Beyond price, builders look at fees, layer-two adoption, and developer activity. Yield-seekers may deploy capital to Bitcoin-secured lending or options strategies, accepting counterparty and strategy risks for incremental return. These approaches depend less on the next move of the Bitcoin price USD and more on risk controls and counterparties.
Common Mistakes to Avoid
The most frequent error is over-exposure. Even with conviction, sizing beyond your risk budget invites forced decisions during routine drawdowns. Chasing parabolic candles without a plan, ignoring funding rates, or dismissing macro shifts can also be costly.
Finally, treating the Bitcoin price USD as destiny rather than as a signal within a broader thesis leads to reactive behavior and missed opportunities.
The Human Element Psychology and Reflexivity
Fear and greed are clichés, but they are also the engine of short-term moves. When price accelerates, narratives justify it; when it falls, new narratives explain the weakness. Recognizing reflexivity doesn’t immunize you, but it creates humility.
The Bitcoin price USD will do strange things around round numbers, prior highs, and headlines. Expecting emotional waves—and planning your behavior in advance—keeps you from handing your edge to the crowd.
The Bottom Line on Bitcoin Price in USD
The Bitcoin price USD is a consensus print in a global, always-on marketplace. It reflects macro liquidity, policy winds, regulatory clarity, the health of Bitcoin’s own network, and the push-pull of derivatives leverage. You don’t need to predict every twist to navigate it well.
Instead, build a routine, respect volatility, align your horizon with your thesis, and treat price as information rather than identity. Over cycles, those habits matter far more than calling a top or a bottom.
Conclusion
Bitcoin is both simple and complex. Simple because the Bitcoin price USD boils down to what buyers will pay and sellers will accept. Complex because that number is shaped by macro currents, regulatory tides, on-chain dynamics, and human psychology.
If you want to read the price rather than be ruled by it, develop a framework that blends technical analysis, on-chain metrics, and macro awareness. Keep your risk rules boring and your research curious. Price will swing; your edge is how consistently you interpret it.
FAQs
Why do different sites show slightly different Bitcoin price USD figures?
Different data providers pull from different exchanges or weighting methods. Because there’s no single official venue, minor variations arise from order book depth, latency, and index methodology. In liquid periods, these differences are small; during stress, they can widen temporarily.
Does the halving guarantee a higher Bitcoin price USD?
No event guarantees price direction. The halving reduces new supply, which can be bullish if demand is steady or rising. However, macro conditions, liquidity, and leverage often dominate the short term. Many investors treat the halving as a tailwind, not a certainty.
How do funding rates affect the Bitcoin price USD?
Funding rates are a mechanism on perpetual futures that keeps prices aligned with spot. Positive funding means longs pay shorts, indicating bullish positioning; negative funding means the opposite. Extreme, one-sided funding makes the market vulnerable to squeezes that can quickly move price.
Is Bitcoin really an inflation hedge if it falls when rates rise?
Over short horizons, the Bitcoin price USD often reacts to rate expectations and dollar strength like other risk assets. Over longer horizons, some view Bitcoin as digital gold because of its fixed supply. The apparent contradiction reflects different timeframes, not necessarily a failed thesis.
What’s a realistic way to monitor Bitcoin without getting overwhelmed?
Pick a compact dashboard: a blended BTC to USD index, the 50- and 200-day moving averages, open interest and funding, exchange net flows, and a brief scan of macro headlines. This setup captures the main forces behind the Bitcoin price USD while avoiding information overload.
