Bitcoin Cup and Handle & Golden Cross Key Indicators for 2025
Bitcoin has seen explosive growth in early 2025, gaining over 50% in value and reigniting bullish sentiment across the cryptocurrency space. While Bitcoin volatility is well-known, seasoned traders often look for specific technical indicators that precede major moves. Two patterns in particular—the “Cup and Handle” and the “Golden Cross”—have repeatedly foreshadowed significant price surges. Now that both have reappeared on Bitcoin’s charts, investors are closely watching to see if history will repeat itself.
Bitcoin Cup and Handle
The cup and handle pattern is a classic bullish indicator often seen in both traditional stocks and cryptocurrencies. It begins with a rounded “cup”-shaped base, representing a long period of consolidation and accumulation, followed by a more minor pullback known as the “handle.” Once the price breaks above the resistance line (the “rim” of the cup), it typically rallies significantly.
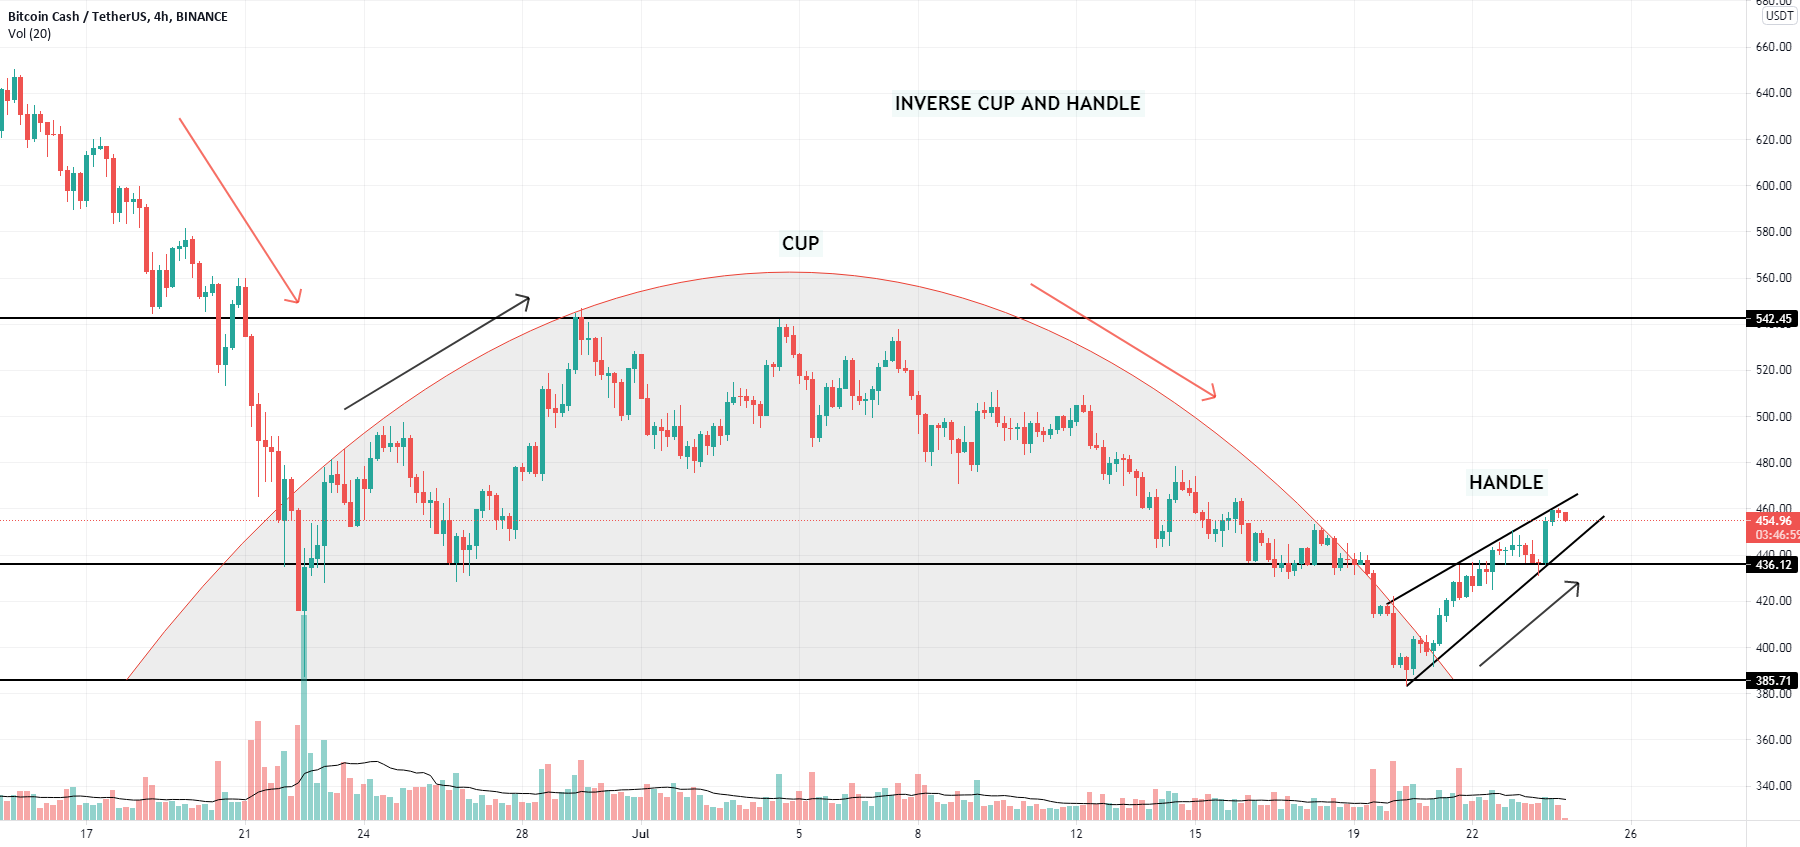
Bitcoin has recently formed a large cup and handle pattern on its weekly chart, according to several technical analysts. The cryptocurrency completed its cup formation during late 2024, with prices slowly climbing back to the $69,000-$75,000 range. More recently, the handle—a brief dip followed by a tight consolidation—has begun to take shape. Analysts suggest that a breakout above $75,000 could serve as confirmation of the pattern, potentially opening the door to targets well above $100,000.
Historical performance supports this thesis. During previous cup and handle formations, Bitcoin’s price surged by 50% to 100% within a few months after the breakout. Analysts such as Mags (@thescalpingpro) highlight how these patterns can forecast aggressive bullish moves when they align with macroeconomic optimism and increased demand.
Golden Cross Breakout
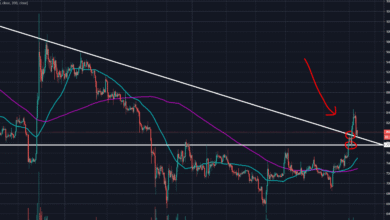
Adding to the bullish momentum is the development of a Golden Cross on Bitcoin’s daily chart. This technical signal occurs when a shorter-term moving average, usually the 50-day simple moving average (SMA), crosses above a longer-term average, such as the 200-day SMA. The Golden Cross is widely interpreted as a strong bullish confirmation and often precedes sustained upward trends.
Bitcoin’s last central Golden Cross occurred in late 2020, shortly before its meteoric rise to over $60,000 in early 2021. The pattern has now appeared again in early 2025, with the 50-day SMA poised to cross above the 200-day line. Given the historical context, many analysts believe this could signal the beginning of another significant bull run.
More importantly, the golden cross appearing alongside the cup and handle pattern reinforces the likelihood of a large-scale breakout. When these two patterns have aligned in the past, Bitcoin has delivered some of its strongest gains.
Bitcoin Institutional Surge
Although technical patterns tell a gripping story, the fundamental backdrop has also become somewhat positive. Particularly once several spot Bitcoin exchange-traded funds (ETFs) were approved in the United States, institutional interest in Bitcoin exploded. In just a few months, these ETFs have attracted over $2 billion, with BlackRock’s IBIT fund drawing alone around $1 billion in inflows.
By locking off a lot of Bitcoin in long-term ownership, this flood of institutional wealth helps lower volatility and offers tremendous purchasing pressure. It also signals increasing general recognition of Bitcoin as a valid store of wealth, thereby drawing perhaps more conservative funds and investors into the market.
Furthermore, supporting demand for distributed and inflation-resistant assets like Bitcoin are favorable macroeconomic variables, including central banks’ rate-cutting speculation and a declining U.S. dollar.
Bitcoin Breakout Signals
 Considering these changes, traders and investors should keep an eye on numerous important levels and markers:
Breakout Confirmation: A continuous movement above $75,000 will verify the cup and handle breakout. Should this occur on a grand scale, Bitcoin might quickly reach $100,000 or more.
Golden Cross Validation: Look for the 50-day SMA to boldly cross over the 200-day SMA. This will validate the Golden Cross and show long-term increasing momentum.
Support Levels: On the downside, $68,000 to $70,000 is starting to show as a main supporting range. A drop below this level might destroy the optimistic setting and start a more general decline.
Volatility Indicators: Currently narrowing Bollinger Bands indicate a significant movement is about to occur. Should price action break higher and bands widen, it might point to a sustained surge.
Final thoughts
Two strong technical patterns—the Cup and Handle and the Golden Cross—alongside strong institutional inflows create the conditions for maybe explosive increases in the Bitcoin Price. Although no technological arrangement assures success, the historical dependability of these patterns provides a strong argument for ongoing upward momentum. Although wary, investors should be prepared, as the next few weeks will be crucial for Bitcoin’s path toward new all-time highs.