
Ethereum Price Analysis ETH Drops in Descending Channel
Ethereum price analysis as ETH tests a key demand zone inside a descending channel. Key levels, trend signals, and scenarios for bulls and bears.

Ethereum price analysis is back in focus as ETH trades under heavy technical pressure. When the descending channel shaping market structure and guiding expectations. Over the past several sessions, sellers have repeatedly defended lower highs. While buyers have shown selective interest near areas where demand historically stepped in. This push-and-pull is exactly what makes the current moment so important: ETH is testing a demand zone while the broader descending channel still dominates the trend.
In practical terms, a descending channel reflects controlled selling rather than panic. Price typically moves between a falling upper boundary (resistance) and a falling lower boundary (support), creating a rhythm of rallies that fade and dips that attract bargain hunters. For traders and long-term holders, this structure provides clarity. If Ethereum price can reclaim key resistance levels and invalidate the channel, the market could shift from “sell the rally” to “buy the dip.” If the channel holds and the demand zone fails, downside continuation becomes the higher-probability path.
Ethereum price analysis always benefits from context because ETH tends to move with broader risk sentiment while also responding to its own ecosystem catalysts. When macro conditions are uncertain, liquidity tightens and traders become more defensive. In that environment, a descending channel can persist longer than many expect, even if Ethereum’s fundamentals remain strong.
At the same time, ETH is not just another speculative asset. It sits at the center of decentralized finance and a large part of the smart contract economy. That matters because periods of price weakness often coincide with shifting capital flows across DeFi, stablecoins, and Layer-2 scaling solutions. Even when Ethereum price action is bearish, network activity can remain resilient, which can eventually create the foundation for a trend change.
From a charting perspective, Ethereum price analysis right now is about structure. The market is communicating through repeated lower highs and disciplined sell pressure. Yet the appearance of a demand zone test suggests buyers are still present, waiting for a better risk-to-reward entry. This is why the next few candles near demand are often more informative than a dozen candles in the middle of the channel.
Descending Channel Explained: Why It Matters for ETH
A descending channel is one of the most useful patterns in Ethereum price analysis because it reflects an organized downtrend. Instead of random volatility, price moves in a relatively predictable manner: rallies tend to stall at trendline resistance, and pullbacks tend to find support near the channel base.
What makes this pattern powerful is that it offers two clear reference points. The upper boundary acts as a ceiling where sellers usually step in, and the lower boundary acts as a floor where buyers may defend. As long as Ethereum price remains inside this descending channel, the trend bias remains bearish-to-neutral, and traders often treat rebounds as temporary until proven otherwise.
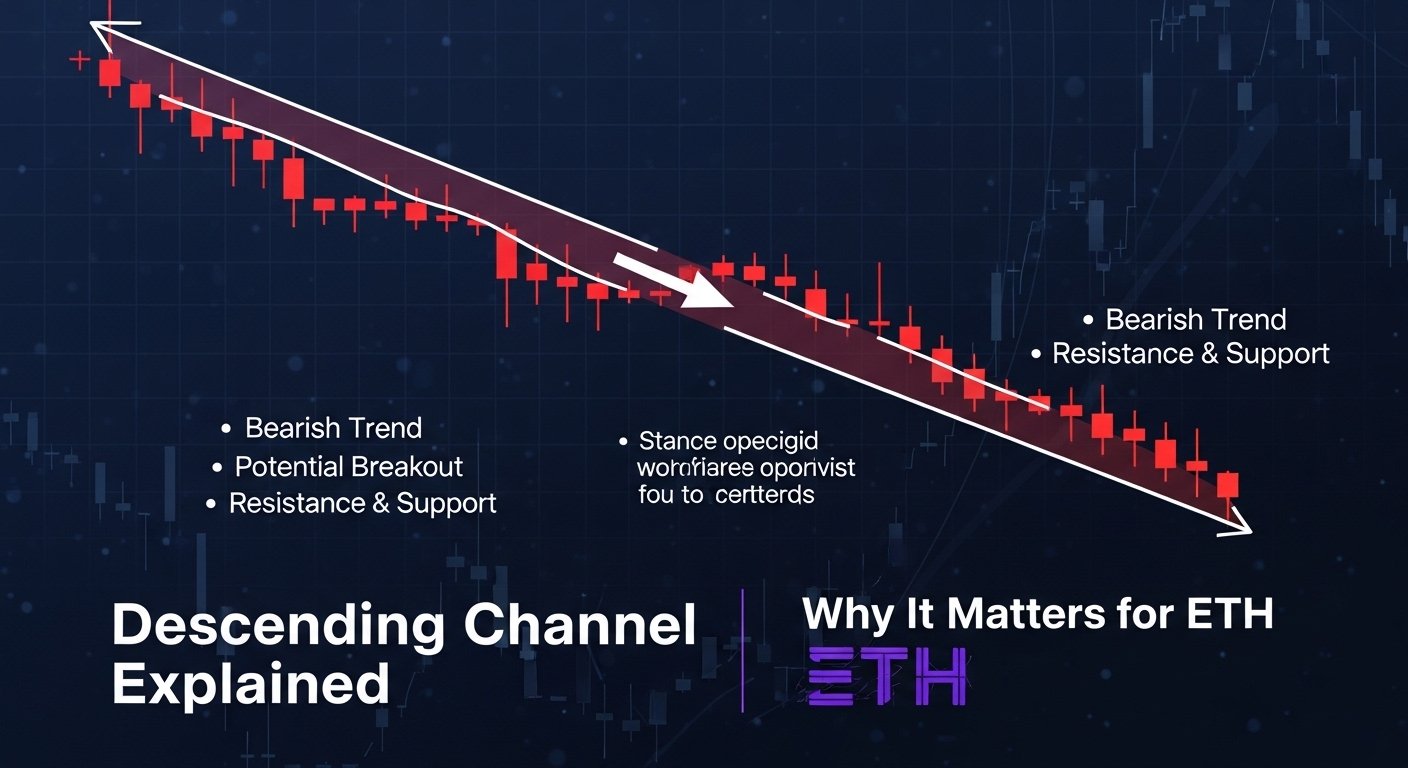
It’s also important to recognize that a descending channel can break in either direction. A breakdown below the channel base can accelerate bearish momentum as stops trigger and buyers retreat. A breakout above the channel top can shift sentiment quickly, especially if the move is supported by volume confirmation and a strong daily close. This is why Ethereum price analysis frequently centers around channel boundaries—they define the battlefield.
How the Channel Shapes Support and Resistance
Support and resistance become more meaningful when they align with a channel. If a horizontal support level sits near the channel’s lower boundary, that region often becomes a stronger demand zone. Similarly, if a key resistance level lines up with the channel’s upper boundary, that area becomes a higher-confidence rejection zone.
In current Ethereum price analysis, this alignment matters because it can determine whether ETH is simply consolidating within a downtrend or preparing for a reversal. The best signals often come from reaction, not prediction. If ETH taps the lower boundary and immediately recovers with strong candle bodies, demand is active. If ETH taps support and drifts lower with weak rebounds, sellers remain in control.
Psychology Behind a Descending Channel
Market psychology is a major driver in Ethereum price analysis. In a descending channel, many participants are conditioned to expect lower highs, so they sell into rallies. That selling pressure reinforces the trendline, which attracts even more sellers. Meanwhile, value buyers step in near the channel base, but often take profits quickly because they don’t fully trust a reversal.
This creates a cycle of short-lived bounces—enough to keep the channel intact, but not enough to change the trend. Breaking that psychology requires a strong bullish impulse that forces sellers to cover and convinces sidelined buyers to step in with confidence.
ETH Tests the Demand Zone: Why This Area Is Crucial
Ethereum price analysis becomes most actionable when ETH reaches a demand zone because the market is forced to reveal its hand. A demand zone is not a single price tick; it’s an area where buyers historically absorbed supply, leading to a bounce or a shift in trend. When ETH revisits that zone, traders watch for signs that the same behavior is repeating.
If the demand zone holds, ETH may stage a meaningful relief rally, potentially traveling back toward channel resistance. If the demand zone breaks, it often signals that buyers are either exhausted or unwilling to defend that level, increasing the probability of a continuation move lower.
In Ethereum price analysis, demand zones matter because they offer defined risk. Bulls can enter near support with a clear invalidation point below the zone. Bears can wait for a breakdown and retest to confirm the zone has flipped into resistance. Either way, the market provides structure rather than randomness.
What Confirms a Demand Zone Hold
A demand zone “hold” is not confirmed simply because price touches it. Ethereum price analysis looks for confirmation through reaction. Strong bullish candles, long lower wicks that show rejection of lower prices, and improved trading activity are all constructive signs.
Another helpful confirmation is reclaiming a nearby minor resistance level after the bounce begins. When ETH breaks above that short-term ceiling, it suggests buyers are not just defending but also gaining momentum. In addition, RSI divergence—where price makes a lower low but RSI makes a higher low—can hint that bearish momentum is weakening.
What Signals a Demand Zone Breakdown
If ETH slices through the demand zone with large bearish candles and limited wick rejection, that often signals dominance from sellers. Ethereum price analysis also watches how price behaves after the breakdown. A failed attempt to reclaim the zone can be an especially bearish sign, because it suggests the market has accepted lower pricing and the former demand zone is now a supply area.
In those moments, bearish momentum tends to increase, and traders look to the next higher-timeframe support levels for potential stabilization.
Key Technical Indicators to Watch in Ethereum Price Analysis
Ethereum price analysis is more reliable when multiple indicators agree. While price action remains the primary signal, indicators help confirm whether a move is supported by momentum or merely noise.
One of the most common tools is the Relative Strength Index. RSI can provide insight into whether ETH is oversold, and it can also reveal divergence that suggests sellers are losing strength. Another widely used indicator is moving averages, especially on the daily timeframe. If ETH remains below key moving averages, rallies often stall. If ETH reclaims them and holds, trend conditions can improve.
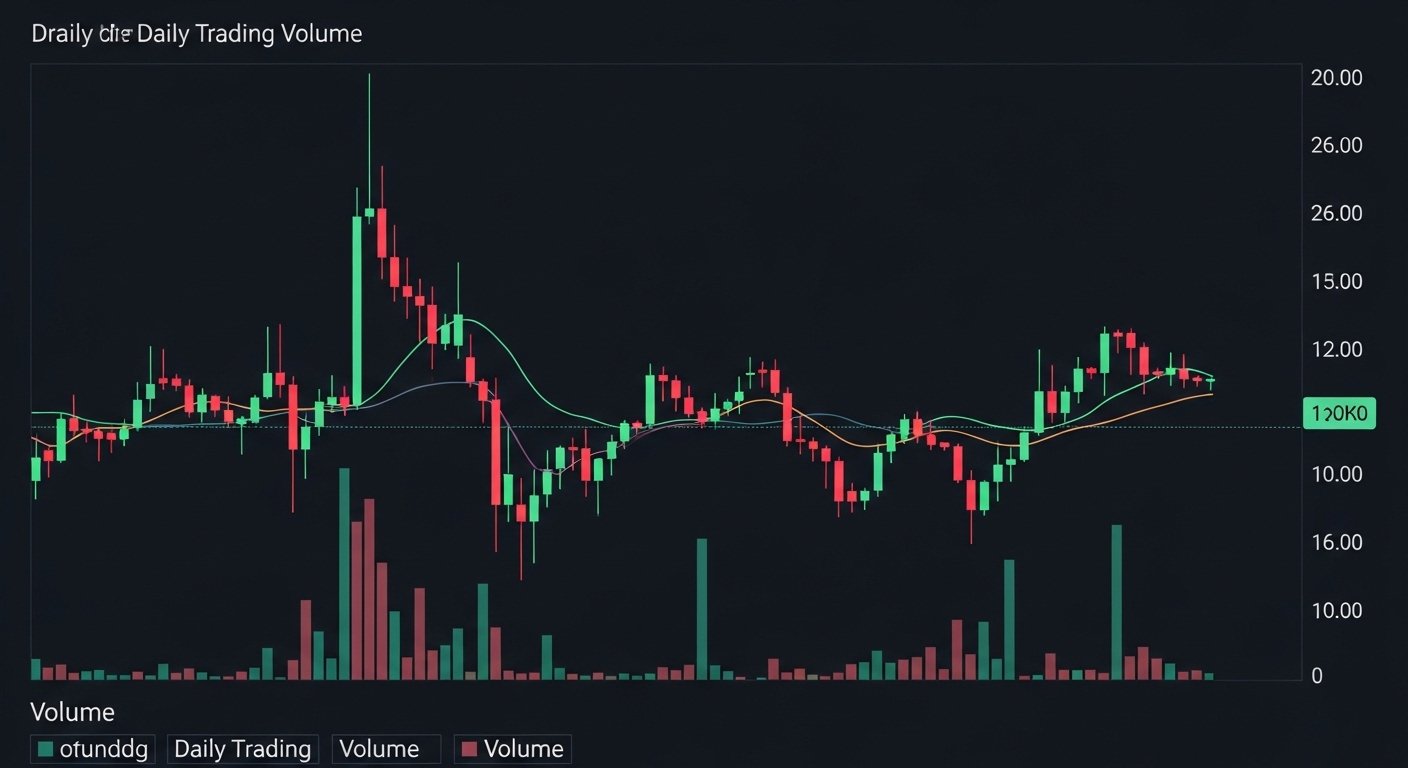
Volume is also essential. Breakouts and breakdowns without participation tend to fail. In Ethereum price analysis, volume confirmation is often the difference between a fake move and a trend shift. When ETH breaks above the descending channel with strong volume, it can indicate real demand stepping in rather than short covering alone.
Momentum and Market Structure Alignment
The best setups in Ethereum price analysis typically occur when momentum aligns with structure. If the descending channel is still intact and RSI remains weak, odds favor continuation or choppy consolidation. If ETH is holding the demand zone and RSI begins to form higher lows, momentum may be turning even before the channel breaks.
This is why traders often plan scenarios. They don’t need certainty; they need conditions. A condition-based approach reduces emotional trading and increases consistency.
Bullish Scenario: ETH Rebounds From Demand and Challenges Resistance
A bullish Ethereum price analysis scenario begins with demand zone defense. ETH holds support, prints convincing rejection candles, and climbs toward the midline and upper boundary of the descending channel. The next key test would be the channel’s upper trendline, where sellers have historically defended. If ETH breaks above that trendline and holds, the structure shifts from lower highs to a potential trend reversal. The most credible bullish break would include a strong daily close above resistance and follow-through that turns old resistance into support.
In this scenario, traders may start targeting higher resistance zones and previous consolidation areas. However, discipline matters. A descending channel does not disappear overnight. Even after a breakout, ETH can retest the breakout area, shake out weak hands, and only then continue higher. Ethereum price analysis favors patience here, because chasing a breakout without confirmation can lead to getting trapped in a fake move.
What Would Strengthen the Bullish Case
The bullish case improves if ETH forms a higher low after the initial bounce. That would be an early sign that buyers are willing to step in sooner, reducing downside pressure. Another bullish factor would be sustained improvement in participation, reflected through stronger volume on green candles and reduced selling pressure on pullbacks. If ETH manages to reclaim key moving averages and maintain that reclaim, it often attracts additional buyers who use those levels as trend filters. That shift can help turn a relief rally into a more durable reversal attempt.
Bearish Scenario: Descending Channel Holds and Demand Zone Breaks
The bearish Ethereum price analysis scenario is straightforward: ETH fails to hold the demand zone and continues to respect the descending channel’s direction. This can happen through a clean breakdown or through repeated weak bounces that ultimately give way. If the demand zone breaks, the market often searches for the next support where buyers may attempt a defense. Bears typically look for confirmation through a breakdown-and-retest pattern, where ETH falls below the zone, returns to test it from underneath, and then rejects. That behavior often signals that sellers have seized control and are using prior demand as new supply.
In a bearish continuation, risk management is crucial because oversold conditions can still trigger sharp relief rallies. Ethereum price analysis emphasizes that trends can continue lower while still producing violent countertrend bounces. This is especially true in crypto, where liquidity pockets can fuel sudden moves in either direction.
What Would Strengthen the Bearish Case
The bearish case strengthens if ETH’s rebounds become smaller and weaker, showing declining buyer interest. It also strengthens if breakdowns occur with increased selling volume, suggesting real distribution rather than a temporary liquidity sweep. If ETH remains below key moving averages and those averages begin to slope downward, that can reinforce trend weakness. In addition, if RSI continues to fail at reclaiming neutral levels, it suggests bearish momentum is persistent.
How to Approach ETH Right Now Without Overreacting
Ethereum price analysis works best when you separate what the market is doing from what you hope it will do. Right now, the market is in a descending channel and testing a demand zone. That’s not a prediction; it’s a description of structure. The strategy comes from responding to what happens next.
If you’re a shorter-term trader, you may watch for confirmation at the demand zone and look for a bounce toward channel resistance, while keeping risk tight. If you’re a longer-term investor, you may focus on whether ETH is building a base or breaking down further, and scale decisions accordingly.
In both cases, the key is respecting confirmation. A single candle is not a trend change. A clean break of the descending channel with follow-through is more meaningful than a brief spike. Likewise, a demand zone breakdown with a failed reclaim carries more weight than a temporary dip that instantly recovers.
Conclusion
Ethereum price analysis currently revolves around one dominant technical message: a descending channel is still controlling the trend, and ETH is now testing a critical demand zone that could decide the next major swing. If buyers defend this zone with strong reaction and reclaim resistance levels, ETH could challenge the channel top and attempt a bullish reversal. If sellers break demand decisively and the channel remains intact, downside continuation becomes the more probable outcome until a new base forms.
The most practical approach is scenario planning with confirmation. Watch how ETH behaves at the demand zone, monitor reactions at trendline resistance, and look for volume confirmation to validate breakouts or breakdowns. In a market defined by structure, patience and disciplined decision-making often outperform prediction.
FAQs
Q: What does a descending channel mean in Ethereum price analysis?
A descending channel indicates ETH is making lower highs and lower lows within parallel trendlines, reflecting an organized downtrend where rallies often face selling pressure.
Q: Why is the demand zone important for ETH right now?
A demand zone is an area where buyers previously stepped in strongly. If ETH holds it, a rebound can follow; if it breaks, price may search for the next support lower.
Q: How can I confirm whether ETH is reversing or just bouncing?
In Ethereum price analysis, confirmation often comes from a breakout above the channel resistance with follow-through, improved momentum signals, and volume confirmation rather than a single green candle.
Q: What indicators are most useful during a descending channel?
RSI for momentum and divergence, moving averages for trend filtering, and volume to confirm participation are commonly used to validate whether ETH moves are sustainable.
Q: Is it risky to buy ETH in a descending channel?
It can be, because the trend bias is still bearish until the channel breaks. Many traders wait for confirmation, while others buy near demand zones with tight invalidation to manage risk.
Also More: Bitcoin Mining Rig for Sale – Buy Profitable ASIC Mining Hardware Today